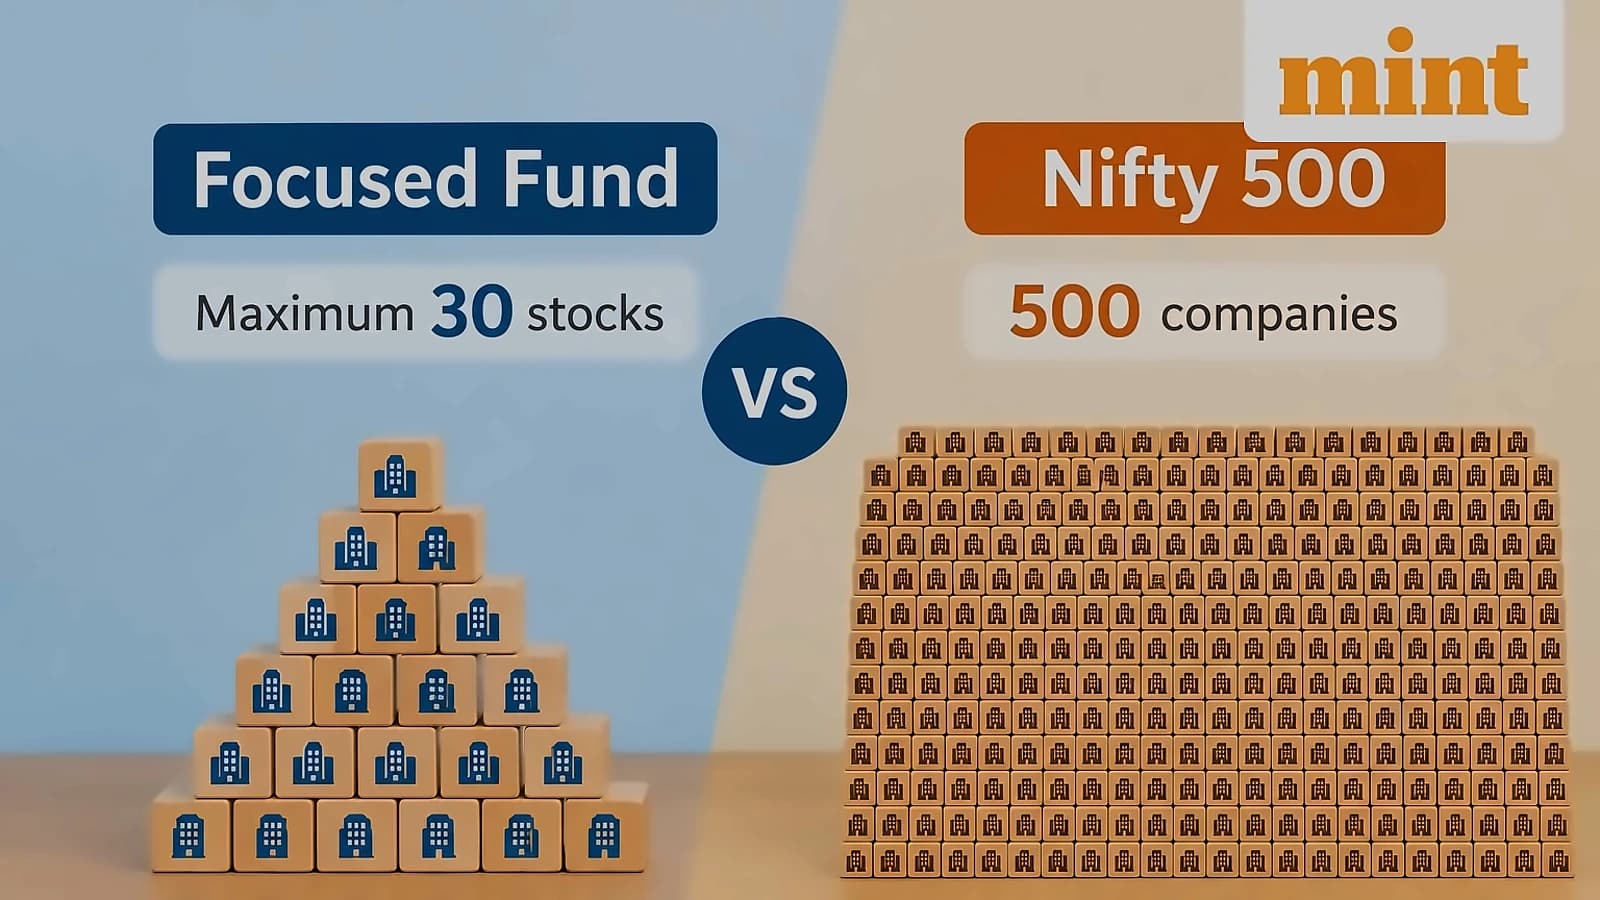
According to AMFI data as of October 22, 2026, SBI Focused Fund, the largest scheme in the category by assets under management (AUM), delivered a 1-year return of 4.02% while its benchmark (BSE 500 TRI) fell 7.95%. The next major fund, HDFC Focused Fund, fell 6.56% compared to the Nifty 500 TRI's decline of 7.64%. As reported by Mint, this performance gap demonstrates the fundamental challenge of comparing concentrated portfolios to broad-market indices. Recent performance data shows Baroda BNP Paribas Focused Fund delivered -3.69% 1-year CAGR compared to its benchmark's -2.03% decline, highlighting the ongoing underperformance trend. The comparison becomes particularly misleading when investors evaluate equity performance over short timeframes, as equity investing requires looking beyond short-term price movements and focusing on businesses' underlying growth over sufficiently long periods.
Focused funds typically use the Nifty 500 TRI or BSE 500 TRI as their benchmark because of their investment mandate under SEBI's uniform benchmark framework. According to Jyoti Bhandari Chandra, Founder of Lovak Capital, the broad-market index offers a common benchmark since focused funds can invest across market capitalizations and investment styles. Bruce Keith, Co-founder & CEO of InvestorAi, noted that the Nifty 50 represents the universe from which these funds can select stocks, and investors have the opportunity to invest in the index through ETFs, making concentrated funds expected to outperform. However, recent data reveals that Baroda BNP Paribas Focused Fund underperformed its benchmark with -3.69% 1-year CAGR compared to the benchmark's -2.03% decline, demonstrating the challenges in achieving consistent outperformance. The Nifty 50 represents 50 major companies listed on the NSE and is commonly used as an indicator of the Indian equity market, but its performance during volatile periods like the 2008 global financial crisis shows how misleading short-term comparisons can be.
A portfolio of 26 holdings may have an active share well above 70%, meaning its holdings and weights differ substantially from the index. As reported by Harsha Vardhana VM, Founder-Group CEO of Atom Financial Services, this shows whether the fee was worth paying but says nothing about how the manager achieved the result. Manish P. Hingar, Founder and CEO of Fintoo, explained that the Nifty 50 is too narrow for many focused funds since they own mid and small caps, making comparison with 50 large companies unfair. Recent performance data shows that focused funds like Baroda BNP Paribas Focused Fund continue to underperform their benchmarks, reinforcing the argument that concentration strategies face inherent diversification challenges. The FD vs equity comparison becomes particularly misleading when investors evaluate equity performance over short timeframes, as equity investing requires looking beyond short-term price movements and focusing on businesses' underlying growth over sufficiently long periods.
Industry experts suggest a composite benchmark built from the fund's own history as a more accurate approach. If a scheme has held about 70% large caps and 30% mid caps over time, a blend of 70% Nifty 100 TRI and 30% Nifty Midcap 150 TRI would test the manager against actual exposure taken. According to Vardhana VM, an industry-standard second benchmark that mirrors each fund's actual market cap mix, kept alongside the Tier 1 index, would provide a sounder approach. Recent performance data demonstrates the need for such alternative benchmarks, as focused funds like Baroda BNP Paribas Focused Fund continue to underperform their benchmarks, suggesting that standard broad-market indices may not adequately capture the true performance of concentrated portfolios. The FD vs equity comparison highlights the fundamental difference between predetermined interest returns and equity's linkage to business growth and profitability.
For investors analyzing focused funds, experts recommend focusing on downside capture, information ratio, and turnover levels. Vardhana VM suggests looking at how the fund performed against the broader market (Nifty 500) and its own style (large-, mid-, or small-cap indices), with the difference between these numbers providing useful information. Keith emphasizes consistency and repeatable alpha in focused funds, while Hingar suggests examining rolling returns over three and five years, checking alpha, information ratio, and downside capture ratio to assess whether outperformance comes from stock selection or sector calls. Recent performance data from Baroda BNP Paribas funds shows mixed results across different strategies, with some funds like the ESG Best-in-Class Strategy Fund delivering strong 10.80% 3-year CAGR while others continue to underperform their benchmarks, highlighting the importance of careful fund selection and performance analysis. The FD vs equity comparison underscores the need for investors to understand that equity investing requires patience and a long-term perspective, while FDs offer predictable returns but limited upside potential.