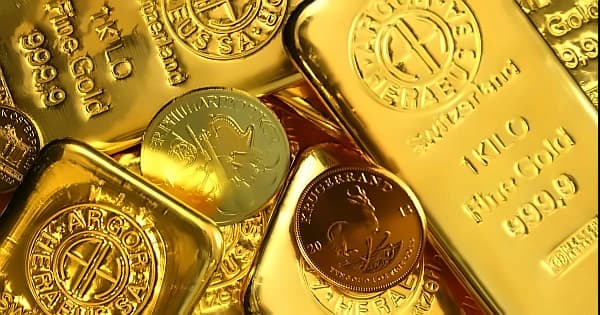
Gold officially crashed through the psychologically critical $4,000 per ounce level on the 24th, marking a decline of more than 28% from its all-time high set in January and formally ending a three-year bull market. Gold fell to its weakest level since early November 2025, hitting an intraday low of $3,942 during early Asian trading hours before recovering slightly to trade near $3,956, down 1.5% on the day. The latest slide comes amid diplomatic pressure as President Donald Trump claims Iran asked for a meeting after the recent exchange of strikes, and he says the meeting will happen in Qatar on Tuesday. However, Iran's Foreign Ministry denies that any meeting with the US is scheduled, with spokesperson Esmaeil Baghaei stating that "We will not have any negotiation meetings at any level with the American side in the coming days." The precious metal is now set for its fourth consecutive monthly fall, with June alone seeing a decline of 12.26%, putting gold on track for its biggest quarterly decline since April 2013.
The U.S. Dollar Index (DXY) climbed to 101.69, its highest level since May 2025 and a more than one-year peak, making dollar-denominated gold more expensive for overseas buyers and further suppressing physical demand. A stronger dollar typically makes gold less attractive to international investors, reducing demand for the precious metal. The dollar strength is occurring alongside other market pressures affecting gold's performance, with the currency eyeing a second week of gains and maintaining its position near its highest level in over a year. Federal Reserve Chair Kevin Warsh held rates steady at his first meeting, yet nine of 18 policymakers expect at least one increase in 2026, which will keep downward pressure on bullion. According to the CME FedWatch Tool, traders now price in an 86% probability of a rate hike in December, sharply higher than the 61% probability seen before the Fed meeting. Markets price in about a 64% chance the Fed will hike rates again by September, with analysts warning that if the Fed ultimately hikes rates three to four times, gold could fall further to $3,800.
The selloff spread across precious metals, with silver falling 1.4% to $57.4, platinum dropping 1.25% to $1,572, and palladium sliding 0.45% to $1,216. All four precious metals faced monthly losses, reflecting broader market uncertainty. The January surge to record highs reversed in March once the US-Iran conflict reshaped rate expectations and lifted bets on Fed hikes. Higher rates lift real yields and weigh on gold, which pays no interest, with the metal making its first move below $4,000 in late June and keeping sliding since. The January surge to record highs reversed in March once the US-Iran conflict reshaped rate expectations and lifted bets on Fed hikes.
Major Wall Street banks slashed their price forecasts, reflecting deepening pessimism about the gold outlook. Goldman Sachs cut its year-end 2026 gold price target by $500 to $4,900 per ounce, down from its prior forecast of $5,400, marking a significant pivot from its famous advice to "buy gold aggressively" in late 2024. Deutsche Bank slashed its third-quarter gold forecast by 22% to $4,300 and lowered its fourth-quarter estimate by 17% to $4,800, with analyst Michael Hsueh warning that if the Fed hikes rates three to four times, gold could fall further to $3,800. Citi cut its three-month gold target from $4,300 to $4,000, while JPMorgan lowered its 2026 average gold price forecast from $5,708 to $5,243 and UBS reduced its year-end forecast from $5,900 to $5,500. The banks highlighted persistent outflows from gold ETFs and noted that onshore gold prices in China are trading at a discount to New York Comex futures, suggesting that a key source of buying power is now weakening.
Gold has broken below its symmetrical triangle pattern and the 200-day SMA, falling to a low of 3,942, its weakest level since November. The 50-day SMA has also crossed below the 200-day SMA, forming a bearish death cross, with the technical picture continuing to favour further downside. Sellers will look to extend losses towards 3,930, the November low, followed by 3,800, with a break below there potentially exposing the psychological 3,500 level. Any recovery would first need to reclaim 4,100, which marks this week's high and the March low, followed by falling trendline resistance around 4,300 and horizontal resistance at 4,350. A move above that level would expose the 200-day SMA around 4,500. For the outlook to improve, bulls would need to see lower real yields, a softer U.S. dollar or an unwinding of hawkish Fed expectations—none of which appear imminent based on current fundamentals. The next moves hinge on the fragile ceasefire and Fed rate decisions, both of which will shape whether gold extends its slide into the second half of 2026.