Bitcoin has confirmed a major technical breakout, reclaiming the $80,000 psychological level for the first time since late January, with the price currently trading at $81,286.38. This isn't just a minor bounce; it's a sustained climb that has erased the year-to-date losses and is now targeting higher ground. The strength of this move is backed by institutional order flow, with the Spot CVD chart showing the line for large orders beginning a sustained upward trajectory. This confluence of price action and specific flow data is a powerful signal that suggests the recent price advance is being driven by genuine buying pressure from sophisticated players, not just retail speculation.
According to Glassnode analyst Checkmate, Bitcoin faces a comprehensive sequence of resistance levels that will determine its near-term trajectory. The analysis identifies $78,000 as the first hurdle, aligning with the average cost basis of short-term holders who have held Bitcoin for less than 155 days. A decisive break above this level would signal that this cohort is back in profit, reducing overhead supply. The $83,000 level represents the most critical resistance, coinciding with Bitcoin's 200-day moving average on the daily chart. This level is widely tracked by institutional and retail traders as a gauge of long-term trend health, with a sustained move above it suggesting the broader uptrend remains intact. The $83,522 level follows as the next major resistance, representing the Fibonacci 0.618 retracement level - a golden ratio zone that is the classic make-or-break area for a full bullish recovery. A decisive break above this level would signal that institutional buying pressure is strong enough to drive the price toward the next Fibonacci level at $98,078.
The breakout's validity is confirmed by specific order flow mechanics that demonstrate genuine institutional interest. The volume heatmap shows bright clusters near $63,500 and $64,200 as key levels to watch, with these zones acting as magnets where a break above can accelerate a rally. The most important forward-looking signal remains the CVD line for large orders, which shows a sustained upward trajectory indicating that significant buyers are actively absorbing sell orders, particularly at key resistance levels. A bullish divergence occurs when price makes a new high but the CVD line fails to confirm it, signaling that buying pressure is weakening. However, the current setup shows a bullish divergence with the CVD line for large orders on a sustained upward trajectory, confirming that the move is being driven by significant, committed capital. A stop-loss order placed just below the recent support level at $79,025 is a critical risk management tool, as this level was the midpoint of the Fibonacci retracement and has now flipped to support after being reclaimed.
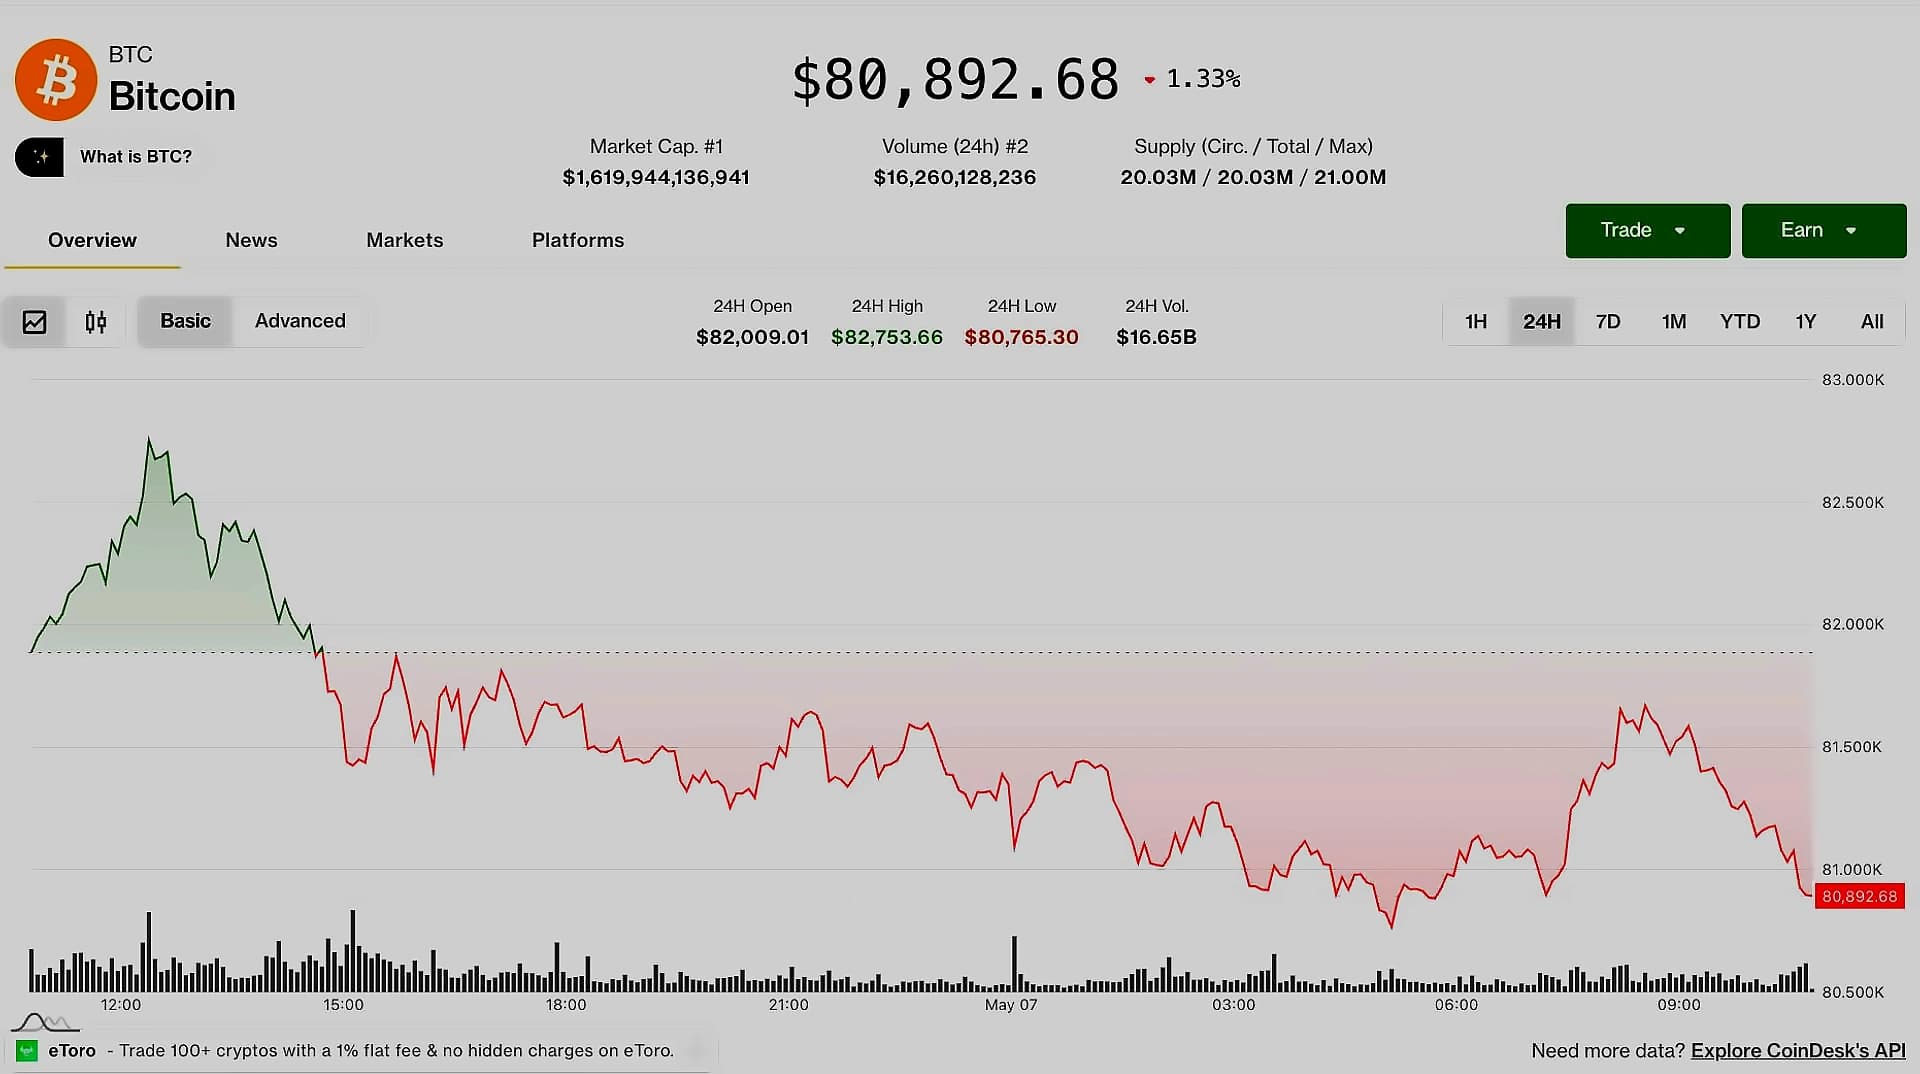
The cryptocurrency market displayed a notable shift on Thursday as altcoins outperformed bitcoin and ether during a period of improved market sentiment. According to reports from Crypto Markets Today, bitcoin held near a three-month high around $82,800 after Wednesday's rally, while ether slipped below $2,400 during European trading hours. The broader market showed early signs of a bullish reversal following a two-month consolidation pattern between February and April, though bitcoin needs to break $98,000 to break its current cycle of lower highs and lower lows. However, Bitcoin's 24-hour flow sits at $113 million while Ethereum's is negative at $-9.95 million, pointing to a potential rotation away from altcoins and into Bitcoin, which could be a sign of risk-off behavior or a flight to perceived safety.
Adding complexity to Bitcoin's current position is a historical pattern showing Bitcoin has often closed May in the red with double-digit losses, creating tangible seasonal headwinds that could override even strong ETF inflows. Fed chair changes have often preceded sharp Bitcoin corrections, with historical data showing drops of 86%, 73%, and 60% following past leadership shifts. With inflation and oil prices elevated, this cyclical risk introduces a tangible downside trigger that could override even strong ETF inflows if a transition looms. The immediate catalyst is a decisive daily close above the $83,522 resistance, with a break below the $79,025 support level invalidating the bullish setup and accelerating the move toward the next major support at $70,000, threatening the integrity of the 100-day moving average at $72,352.