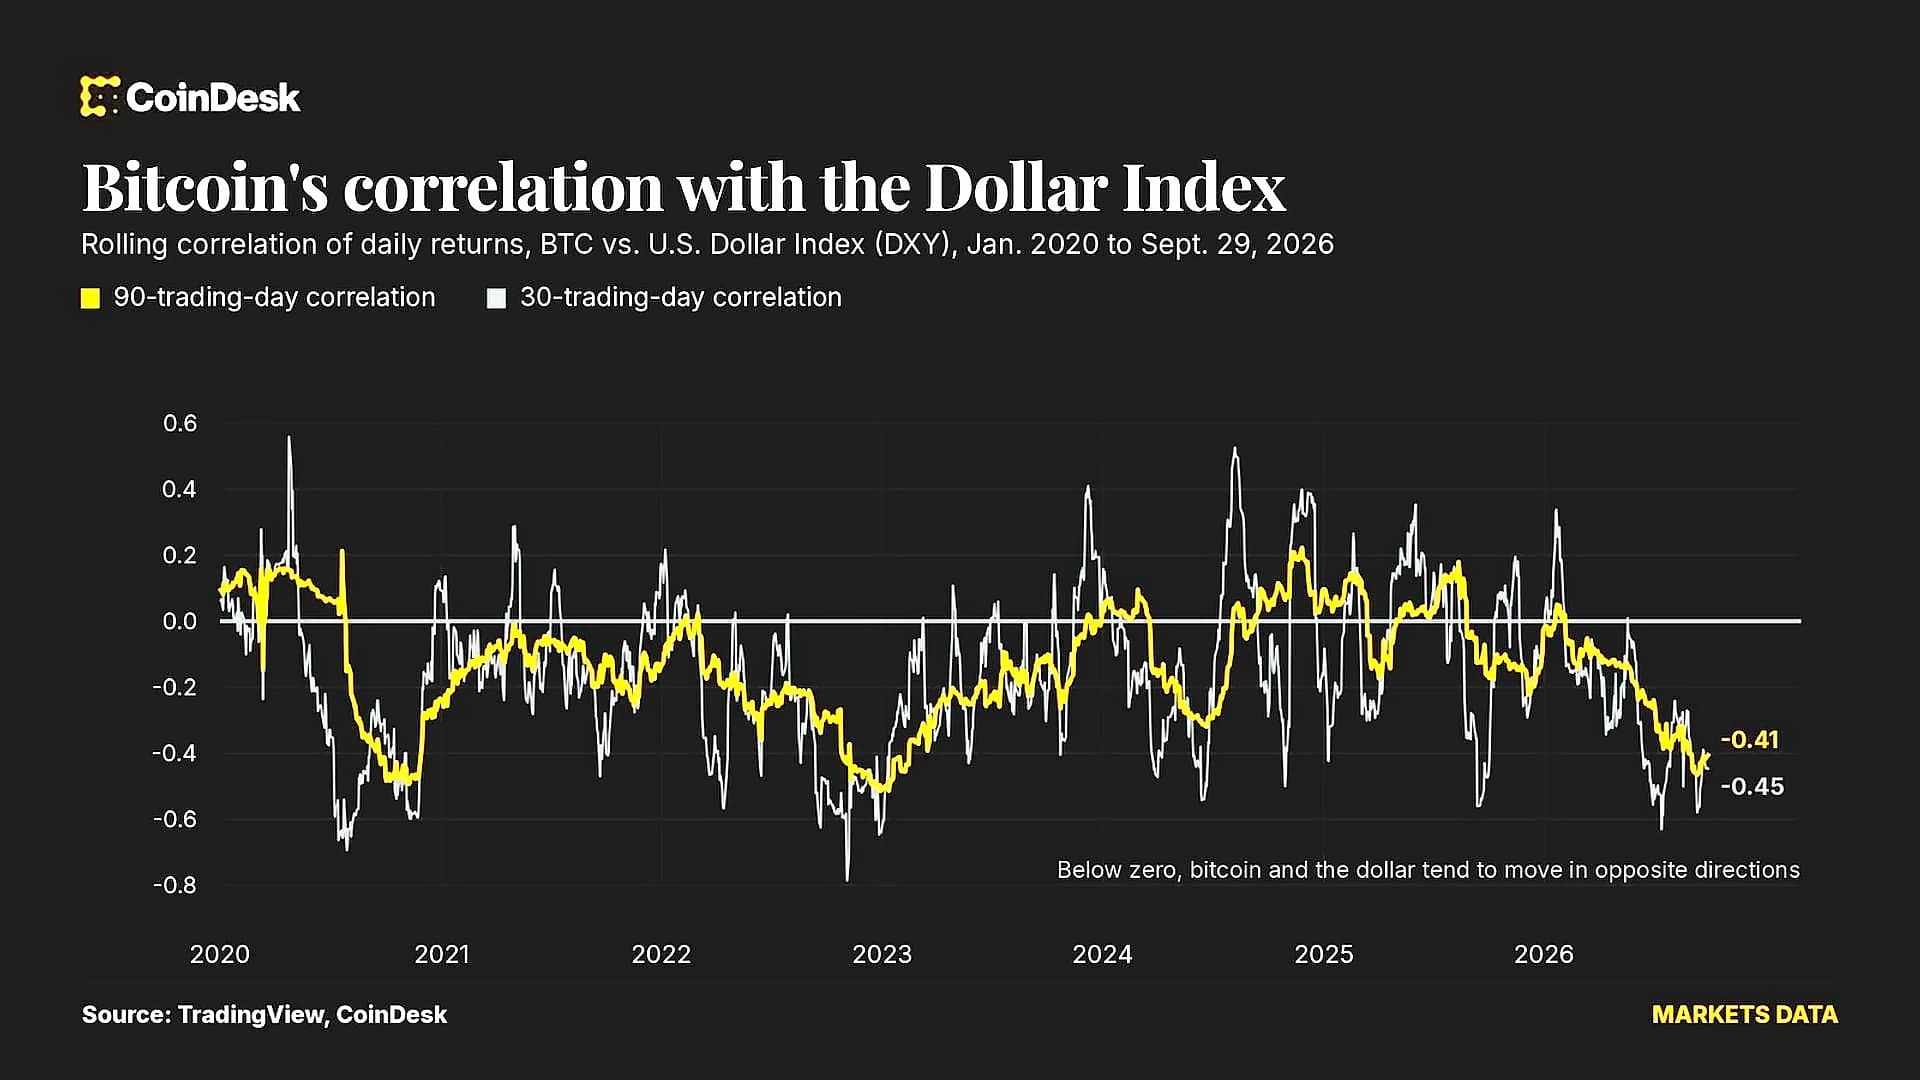
The US Dollar Index (DXY) is breaking out toward 101 after forming a double bottom on the daily chart, marking a significant technical development that historically weighs on Bitcoin prices. According to market analysis, this move would typically align with Bitcoin's traditional inverse correlation pattern, where the cryptocurrency has moved in opposite directions to the dollar for over a decade. However, Bitcoin currently trades near $80,000, down from recent highs as the latest correlation whipsaw demonstrates the complex relationship between institutional and retail demand regimes. The DXY's break above 100.393 represents a critical test for Bitcoin's institutional decoupling thesis, with the next few weeks potentially answering whether Bitcoin has genuinely diversified its demand base or remains sensitive to traditional macroeconomic factors.
Spot Bitcoin ETFs now hold nearly ₹8,400 crore ($100 billion) in assets, with BlackRock alone capturing roughly 70% of April's $2.44 billion in inflows - the strongest monthly performance of 2026. However, May 13 saw spot Bitcoin ETFs post $635 million in net outflows, marking the largest single-day withdrawal since late January. This dramatic shift in institutional behavior occurred when PPI data came in far above expectations at 1.4% month-over-month and 6.0% year-over-year, suddenly pricing a 36% chance of Fed rate hikes in 2026. The dollar surged as FOMC doves shifted to a no-cut stance, demonstrating that institutional capital now responds to macro signals just like traditional risk assets. US spot Bitcoin ETFs recorded roughly $131 million in net inflows on Thursday, a sharp reversal of the prior session's outflows, confirming that institutional positioning remains intact through the consolidation.
The US 10-year Treasury yield broke above 4.55% on Friday, the highest reading since May 2025, while the long bond at 5.12% printed the highest 30-year yield since June 2007. The CME Group's FedWatch Tool shows that fed funds futures now imply a more than 60% probability that the Federal Reserve's next policy move under newly sworn-in Chair Kevin Warsh is a hike rather than a cut, with the 0.25% increase pricing in as the most likely outcome by March 2027. Bitcoin moved in tandem with American equities once the New York session opened, suggesting that the asset's correlation with US risk markets remains the operationally dominant relationship. When real yields rise, capital that would otherwise allocate to non-yielding assets receives competitive returns from short-duration Treasuries, creating a mechanical increase in the opportunity cost of holding Bitcoin. Friday's session captured this dynamic with brutal clarity: as Treasury yields broke higher, the S&P 500 surrendered gains and BTC-USD broke beneath $80,000 in synchronized fashion.
For more than a decade, the DXY and Bitcoin have generally moved in opposite directions, with data from Bitcoin Counterflow dating back to 2011 clearly visualizing this pattern. As reported by market analysts, Bitcoin expansion phases in 2013, 2017, and 2020 lined up with DXY weakness below 90, while DXY rallies in 2014, 2018, and 2022 coincided with deep BTC drawdowns of 60% or more. The mechanism behind this link is straightforward - a weaker dollar typically signals looser financial conditions and higher risk appetite, both historically lifting Bitcoin alongside other risk assets. Recent analysis shows mixed correlation patterns across 2026, with both positive and negative correlations occurring at different periods, creating what analysts describe as a correlation whipsaw. However, Bitcoin has demonstrated selective decoupling from major Asian equity benchmarks, with Japan's Nikkei 225 dropping 1.99% and Hong Kong's Hang Seng Index falling 1.55% under pressure from rising oil and macroeconomic uncertainty, while BTC-USD maintained its higher-low structure.
Bitcoin's underlying chart structure is materially healthier than it was a month ago, when the asset traded near $74,604.22 and the broader market carried scars from the February drawdown that bottomed near $61,000. The recovery sequence has lifted BTC-USD roughly 7.39% on a thirty-day basis and approximately 32% off the February low, framing the current consolidation as a digestion phase rather than a reversal. The single most authoritative reference sits at $82,941 - the 200-day exponential moving average - and the cluster of resistance immediately above it, extending to $83,095, which represents the gate that must be cleared for any honest claim of a regime change. The 20-day EMA at $79,391 and the 50-day EMA at $76,695 sit beneath spot, confirming that the intermediate-term framework is constructive. The relative strength reading on the daily candle prints at 57.9, describing a market in which buying pressure has the directional edge but with meaningful room to extend before reaching the 70 overbought threshold. The 15-minute Bollinger middle band at $80,683 marks local equilibrium, with the upper band at $81,016 and lower at $80,351 defining a tight container that compresses price action effectively.