The S&P 500's cumulative advancing/declining line has rolled over and failed to confirm the index's rally to new highs, creating a classic warning sign of weakening market breadth. According to Investing.com India, while prices have been moving toward new highs, the cumulative A/D line has failed to make new highs, with multiple failed attempts by the A/D line to confirm the rally. The technical indicator shows price making higher highs while the A/D makes lower highs, with a recent breakdown in the A/D line as price stalls. This breadth divergence, while not always triggering immediate crashes, has historically signaled many important market tops, including the red box example in Investing.com's analysis.
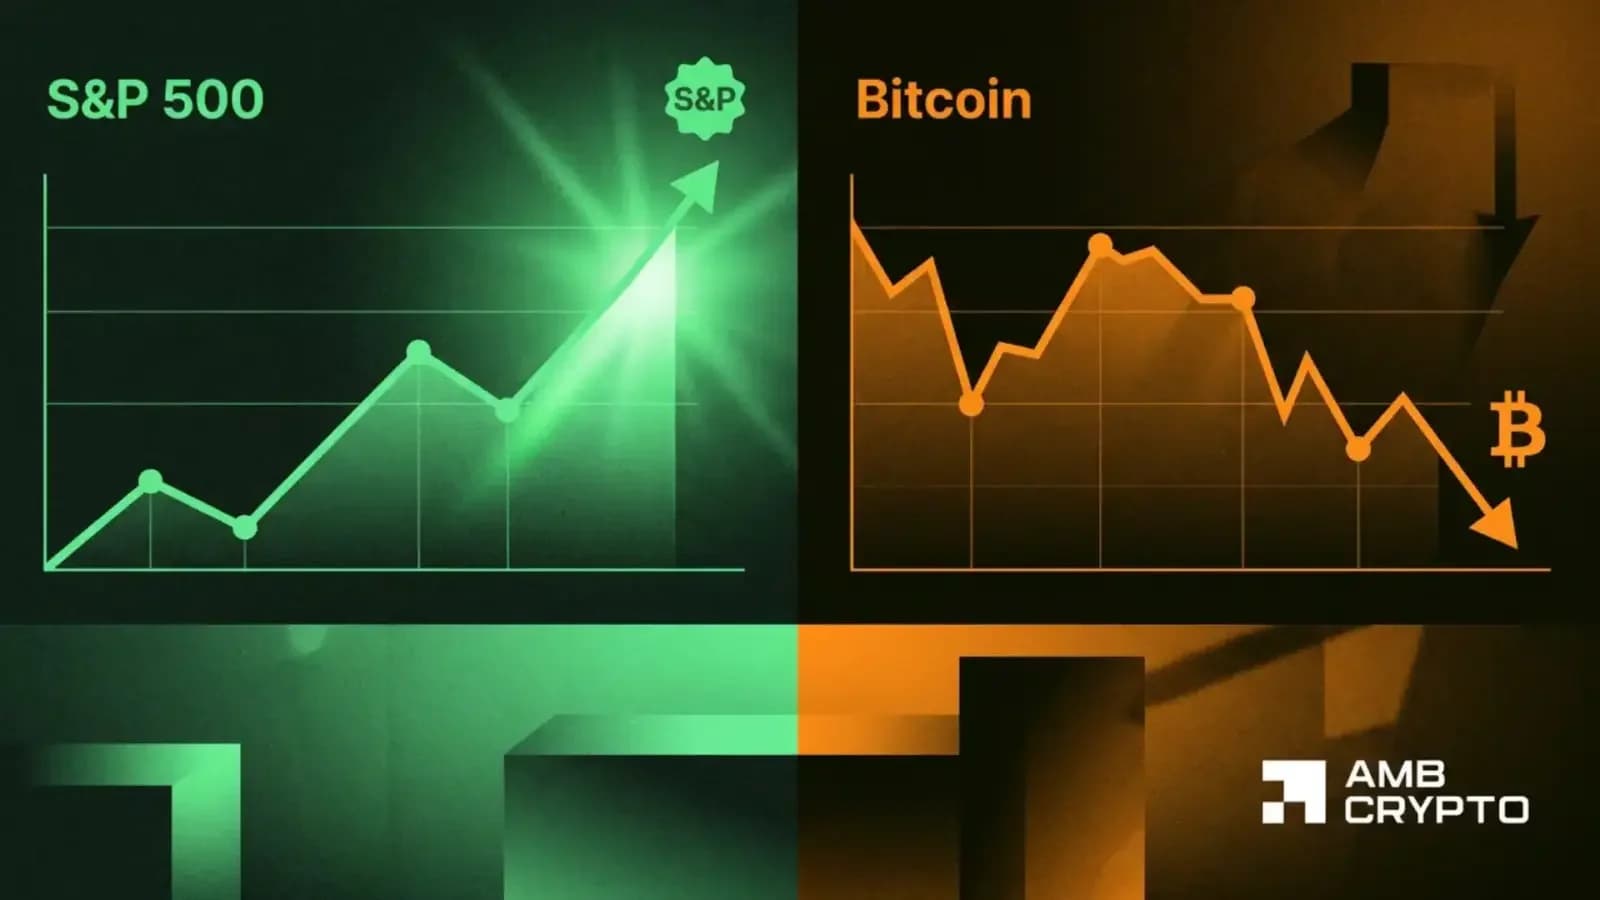
Bitcoin's 11% decline in Q2 2026 tracks a significant rotation of capital into artificial intelligence, defense, and energy sectors, according to Binance Research. The institutional research arm attributes the weakness to capital being pulled into a narrow set of powerful themes in the S&P 500, leaving Bitcoin on the sidelines. The firm pointed to the Cboe Dispersion Index, which has climbed to 42, its third-highest level on record, suggesting that market gains are heavily concentrated in a limited number of stocks or sectors. In the current cycle, investors are crowding into artificial intelligence, semiconductors, defense, energy, and commodities, creating a simple liquidity problem for Bitcoin. As money concentrates in stocks, less liquidity is available for crypto assets, making Bitcoin a funding casualty rather than the source of the weakness.
The current pattern mirrors several past periods when intense equity-market rotations coincided with Bitcoin declines. As reported by Binance Research, in 2015, capital moved into FAANG stocks and biotech while Bitcoin fell 20%. In 2016, a defensive equity rotation matched an 18% Bitcoin drop. Late-cycle FAANG strength and the ICO collapse in 2018 came alongside a 68% fall in Bitcoin. The same pattern appeared again in 2022, when energy stocks surged and Bitcoin lost 50%. The firm also pointed to the fourth quarter of 2025, when AI and semiconductor stocks gained more than 200% while Bitcoin declined 39%. The latest pressure is smaller but still meaningful, with a combined rotation into AI, defense, and energy coinciding with the 11% Bitcoin decline in Q2 2026.
Bitcoin's selloff extended into Wednesday following Strategy Inc.'s sale of a tiny portion of its massive cryptocurrency stockpile, which rattled sentiment and widened the token's divergence from record-setting technology shares. According to Bloomberg reports, this latest development has intensified the ongoing separation between Bitcoin and the broader technology sector, highlighting the cryptocurrency's current struggles to maintain momentum alongside traditional tech stocks. The sale has reinforced the market's perception that Bitcoin is no longer benefiting from the same momentum that has driven technology stocks to record highs. Recent developments show BlackRock and the Winklevoss twins shifting over 7,000 BTC into exchange wallets within hours on June 2, intensifying speculation about institutional distribution patterns.
Despite the current challenges, Binance Research points to historical recovery patterns that suggest potential for Bitcoin's rebound. The firm noted that in past periods when the Cboe Dispersion Index reached extreme levels, Bitcoin often found a bottom within zero to 20 weeks, with the median being about two weeks in cases without a crypto-native crisis. The current downturn does not appear to be caused by a major internal crypto shock, but rather by temporary capital diversion into equities. Glassnode on-chain readings suggest the current bear market has not yet printed a cycle low, even with Bitcoin near $67,000. The Long-Term Holder Net Unrealized Profit and Loss metric sits near 0.25, only grazing the upper edge of the historical capitulation band. Long-term holder supply just printed a fresh all-time high near 15 million BTC, indicating the cohort is absorbing coins from younger, weaker hands. Technical analysis shows Bitcoin testing the $66,900-$68,000 shelf with RSI at 22.13 in oversold territory, while the bearish MACD and confirmed downtrend keep momentum on the sellers' side.