President Donald Trump has announced what he called the "most crushing economic operation" against Iran, as Washington ramps up pressure on Tehran amid a deadlock in talks to end the war between the two countries. In a post on Truth Social on Wednesday, Trump said Iran has "failed to take" the opportunity to make a deal, and would face "economic warfare and isolation on an unprecedented scale". Iranian Foreign Minister Abbas Araghchi has dismissed US President Donald Trump's newly announced sanctions campaign as a diversion from domestic American issues, warning that the "so-called 'Economic D-Day'" would only bring further defeat to Washington. Trump also threatened sanctions against any country that does business with Iran, stating that "ANY country that allows its financial institutions, businesses, airports, or government entities to provide any type of lifeline to Iran will itself face TREMENDOUS Economic Consequences." The US Treasury is helping Trump by introducing long-dated bond buybacks, resulting in US public debt exceeding $40 trillion for the first time, adding fiscal pressure to the economic warfare strategy.
Gold has advanced to a fresh high since early June, reaching approximately $4,583.83 during Wednesday's trading before closing at $4,547.36, building momentum above a technically significant 200-day Simple Moving Average (SMA). The precious metal's latest surge comes as traders scaled back their bets for an immediate interest rate hike by the Federal Reserve after the latest US inflation data released last week pointed to signs of cooling price pressures. This keeps the US Dollar (USD) depressed near its lowest level in over three months, touched on Thursday, which turns out to be a key factor supporting the non-yielding bullion. The US Dollar was the weakest against the Japanese Yen, declining 0.38%, while showing mixed performance against other major currencies with EUR gaining 0.14% and GBP rising 0.11%. The XAU/USD pair seems to have found acceptance above the 200-day SMA, with bulls now awaiting a move beyond the 61.8% Fibonacci retracement level of the April-June decline before placing fresh bets.
The Iran conflict has reached its 174th day, with grim geopolitical developments propelling global crude to nearly $94 a barrel today — its highest level since late July after President Trump threatened "crushing economic warfare" against Iran. As reported by The Economic Times, Wood noted that the price gap between crude oil and refined products such as diesel has continued to widen, with the Diesel Crack Spread rising above $100 a barrel for the first time ever on Monday. The economic pressure surrounding Iran continues to disrupt energy markets, with Wood stating that the latest strategy appears to be based on hopes that economic pressure will force Tehran back to the negotiating table, but he would not bet on such an outcome. Tehran has every incentive to maintain the pressure until the US mid-term elections, which are now 11 weeks away. Yemen's Iran-backed Houthi militant group claimed to have targeted eight oil tankers since declaring a maritime blockade on Saudi shipping in late July, raising the risk of a broader regional conflict and lifting oil prices to a three-week high on Thursday. Market participants worry that disruptions to these facilities and shipping through the Strait of Hormuz could create a supply gap exceeding 10 million barrels per day.
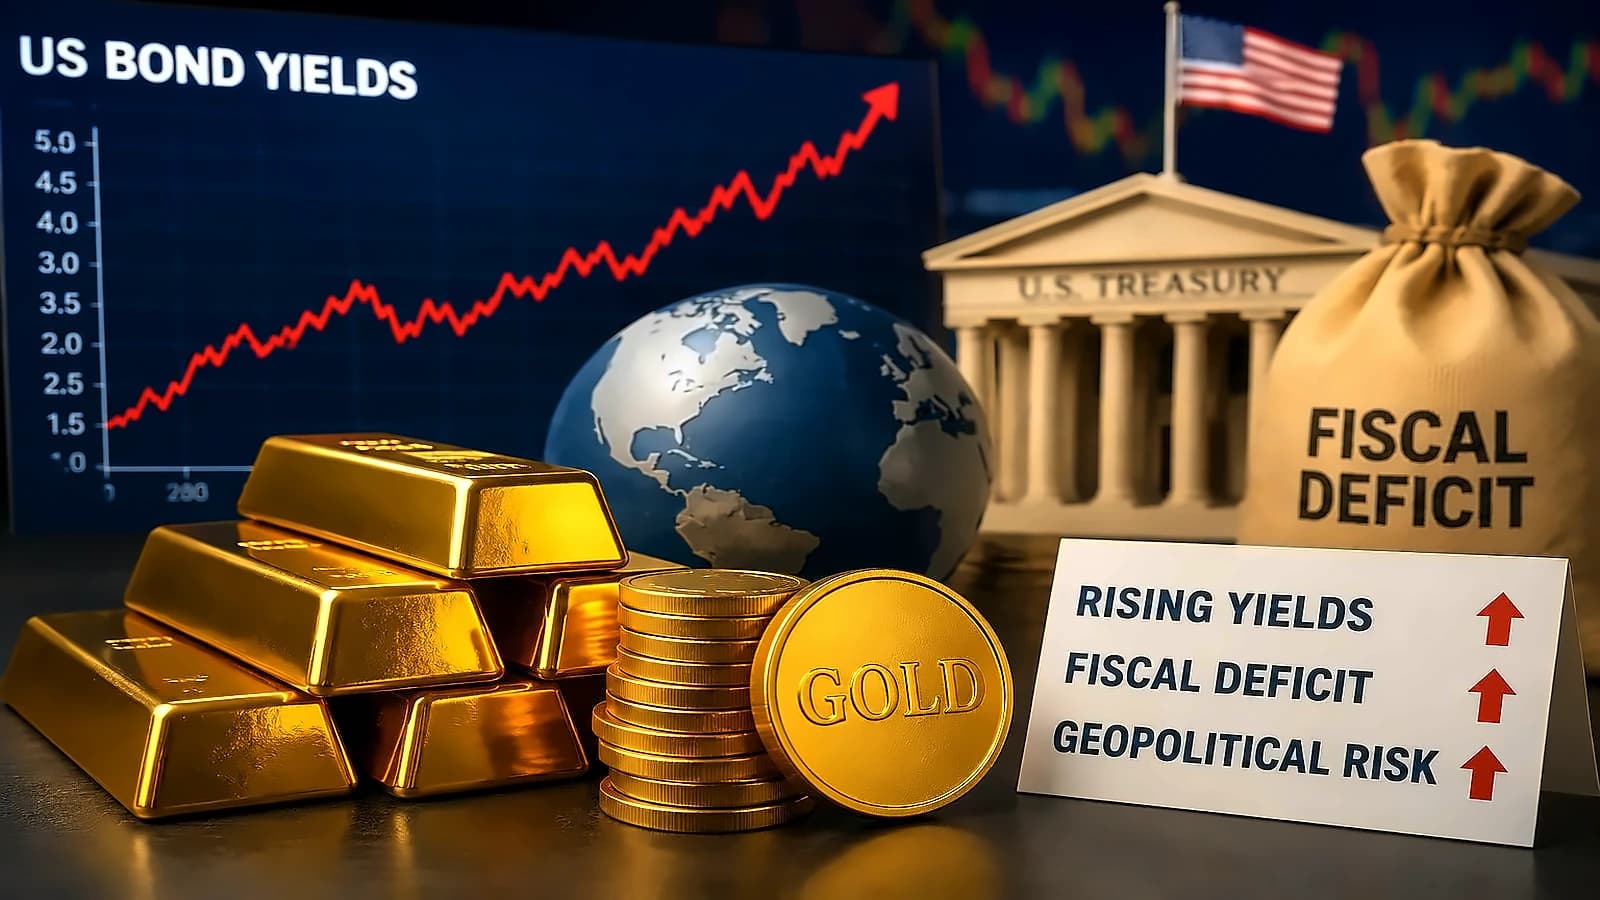
Minutes from the July 28-29 FOMC meeting, released on Wednesday, revealed that Fed officials indicated the need to raise interest rates soon unless there was more progress on bringing down inflation. However, CME Group's FedWatch Tool indicates that investors are still pricing in around a 68% chance that the US central bank will raise borrowing costs at least once by the year-end. This policy uncertainty, combined with persistent geopolitical uncertainties, could help limit deeper losses for the safe-hen buck and hold back bullish traders from positioning for any further appreciating move for gold. The U.S. 30-year Treasury yield has broken above 5.3%, reaching its highest level since 2007, yet gold has maintained its upward momentum with New York gold futures breaching $4,600 per ounce intraday and spot gold trading around $4,536.7 per ounce, marking its highest level since early June. According to Yuanta Securities, what determines gold's direction is not the absolute level of interest rates, but the reason rates are rising.
Gold mining equities are demonstrating significant outperformance as the VanEck Gold Miners ETF (GDX) surged 36.5% over the past month, significantly outperforming the SPDR Gold Shares (GLD) spot gold ETF's 12.3% gain. As reported by BigGo Finance, mining companies have high fixed-cost structures, meaning margins expand rapidly when gold prices rise. In the first quarter of this year, while total sustaining costs for gold miners rose 16.2% year-over-year, gold prices climbed 49.4%. Yuanta Securities emphasized that gold mining equities could offer greater upside elasticity than spot gold, noting that approximately 99% of global gold production sits at cost levels below the current gold price, so even if a price correction occurs, most gold miners will remain profitable. Ko added that we have entered a phase where 'why gold is rising' matters more than 'whether it will rise'. Jefferies also sees improving financial fundamentals among gold-mining companies as an additional reason for investors to consider the sector. According to the report, gold miners are generating increasingly strong free cash flow at a time when free cash flow trends across the broader S&P 500 are moving in the opposite direction.
The XAU/USD pair seems to have found acceptance above the 200-day SMA, with bulls now awaiting a move beyond the 61.8% Fibonacci retracement level of the April-June decline before placing fresh bets. On a daily chart, gold futures are trying to hold the gains, despite facing significant resistance at the peak, tested on Wednesday, as after opening the day at $4,567.79, tested the day's high at $4,596.85, and day's low at $4,506.21, trading at $4,564.50, signalling extensive indecisiveness. The Moving Average Convergence Divergence (MACD) indicator remains positive, reinforcing the upward bias, while the Relative Strength Index (14) at 67.70 flirts with overbought territory, hinting at strong but potentially stretched bullish momentum. The broader technical setup suggests a constructive near-term tone, with sustained strength above the 61.8% Fibo at $4,529 paving the way for additional gains to the 78.6% retracement at $4,687, ahead of the cycle high at $4,889. On the downside, immediate support is seen at the 61.8% retracement at $4,529.03, followed by the 200-day SMA at $4,514.16 and then the 50% retracement near $4,417, with deeper floors emerging at the 38.2% level at $4,306.50 and the structural low anchored near $3,946.