Sign in to fuzzto save your conversations, follow your research and come back anytime.

In the news

Senco Gold Q2 shows 31% revenue growth, shares surge 12%
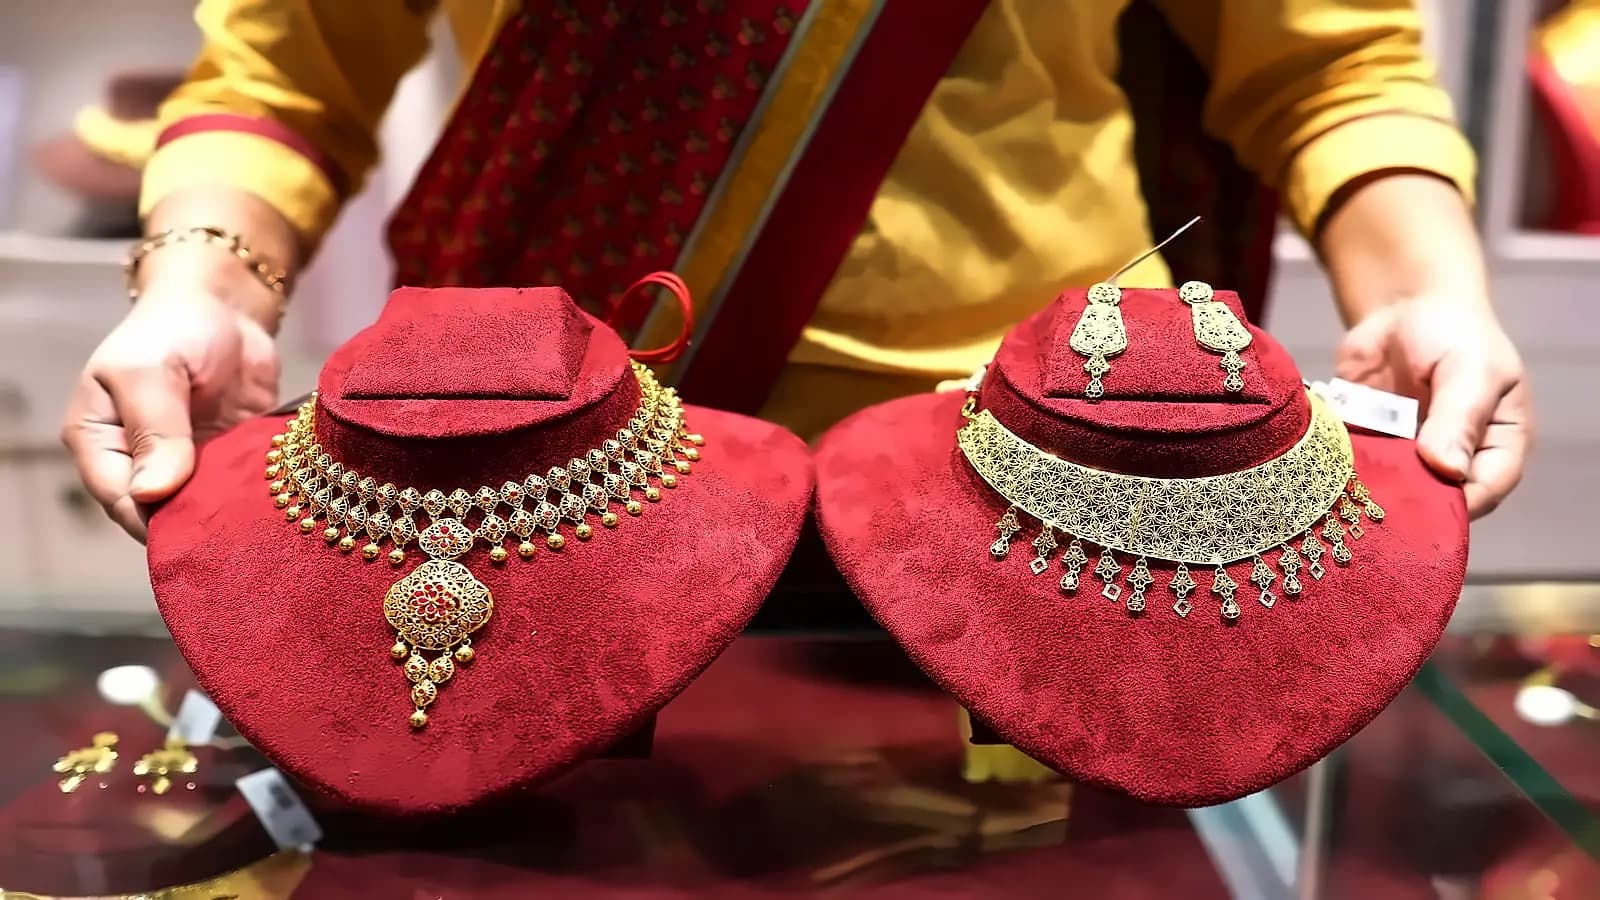
Senco Gold Q2 Revenue Jumps 29% on Festive Demand

5 Smallcap Stocks to Watch as Festive Spending Rises

67 Companies Trade Ex-Dividend This Week: Gillette India, MCX, NALCO
Jewellery Stocks Under Pressure: PM Modi's Gold Appeal and Regulatory Storm

Gold Import Price Cut: Jewellers Get a Cost Break

Senco Gold Extends Melorra Partnership Until 2026, Shares Edge Higher
The Quarter story
The two most recent quarterly results, compared side-by-side.
Senco Gold expands stores and digital users, but faces seasonal margin pressure and higher working capital costs.
Showroom count grew from 185 in Q1 FY26 to 209 in Q1 FY27 — wider physical reach to capture local demand
Adjusted EBITDA margin cooled from 13.7% in Q4 FY26 to 7.0% in Q1 FY27 — seasonal demand shifts are squeezing profitability
Same-store sales growth jumped from 19.6% in Q1 FY26 to 39% in Q1 FY27 — existing stores are pulling in more customers
Other expenses jumped from ₹723.9 Cr in Q2 FY26 to ₹1,945.7 Cr in Q1 FY27 — operational overheads are eating into margins
App users surged from 5 in Q2 FY26 to 122,200 in Q1 FY27 — digital platform is gaining serious traction
Working capital borrowings surged from ₹4,383.3 Cr in Q2 FY26 to ₹22,800 Cr in Q1 FY27 — funding inventory and store expansion requires more debt
Average ticket value rose from ₹79,400 in Q1 FY26 to ₹1,24,200 in Q1 FY27 — customers are spending more per visit
Blended borrowing cost rose from 6.9% in Q3 FY26 to 7.7% in Q1 FY27 — higher interest rates are increasing financing costs
Inventory days fell from 169 in Q1 FY26 to 152 in Q1 FY27 — stock is moving faster through the system
FII shareholding fell from 8.22% in Q3 FY26 to 6.87% in Q1 FY27 — foreign investors are reducing their stake
Company insights, generated from the most recent coverage.
Hedging covers only about 50% of Senco's gold exposure, against Sky Gold's ~99%. A further fall in gold prices hits Senco's inventory valuation far harder than any organised peer.
Senco is lifting studded from 11% toward 15%+ of mix while pushing franchises into smaller East Indian towns. Studded share is the only durable margin lever available to it, since bullion and coin carry almost none.
Senco flagged a conservative view on Q4 precisely because Dhanteras lifted Q3 FY26. Management is deliberately guiding down the quarter that follows its own peak, signalling it expects pull-forward rather than incremental annual demand.