Sign in to fuzzto save your conversations, follow your research and come back anytime.

In the news
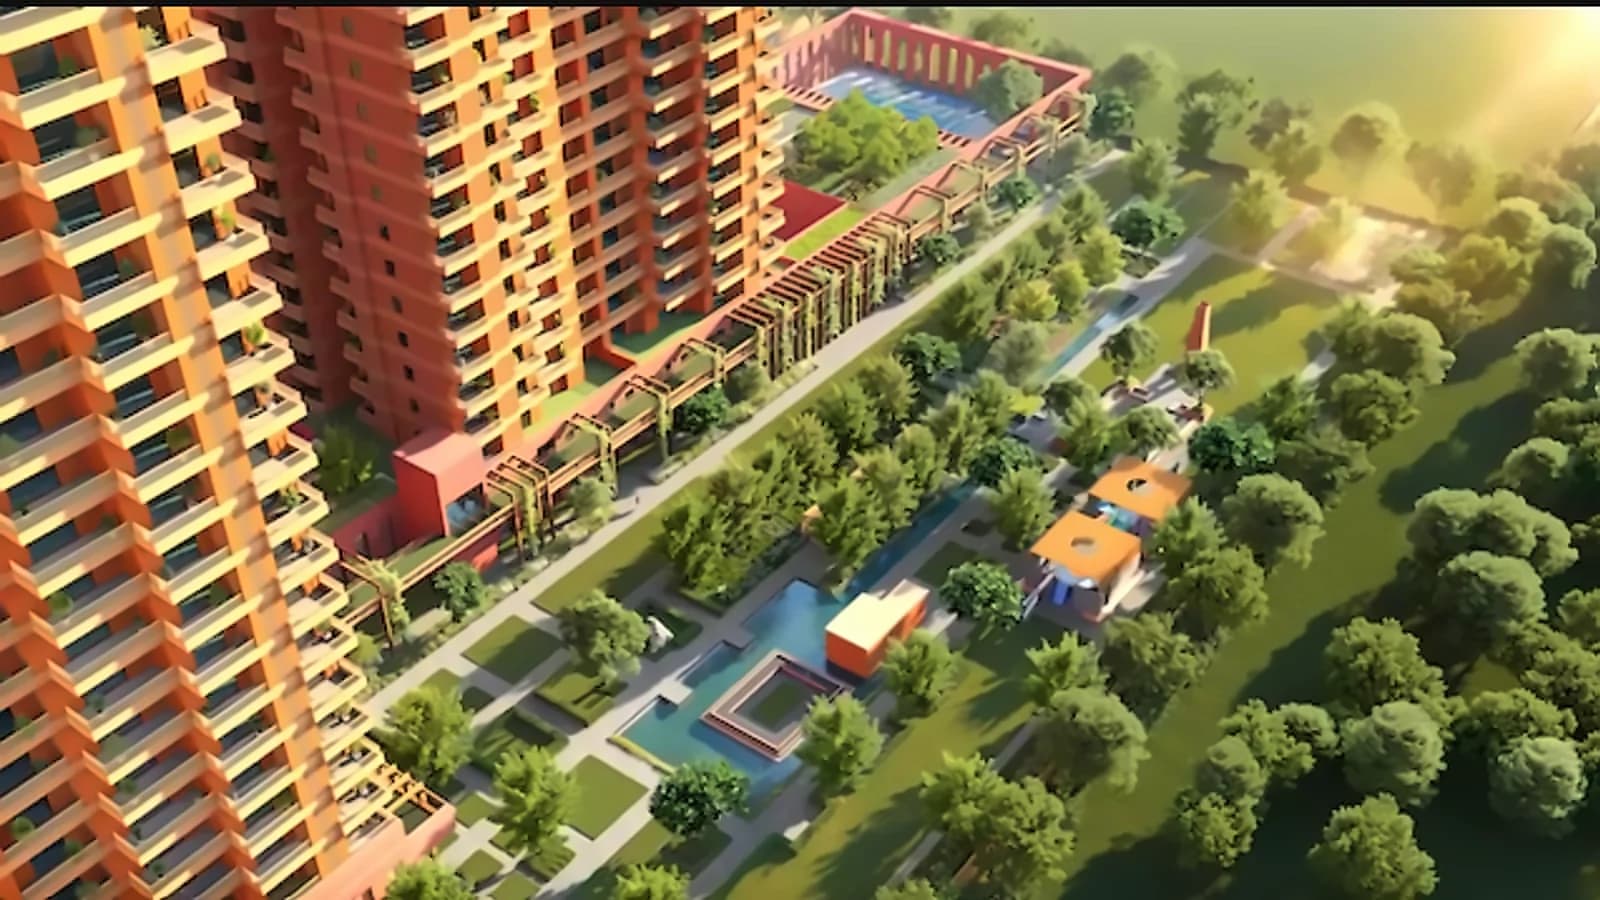
Max Estates shares hit 52-week high on ₹2,500-3,000 cr Ghaziabad project
Max Estates' Delhi Gamble: A Share-Swap Masterstroke
Max Estates surges 2.60% on ₹420 cr Delhi land acquisition

Max One achieves ₹37,000/sq ft record in Noida luxury housing

Max Estates Q1 profit drops 30% to ₹8.35 cr despite 5x pre-sales jump

Max Estates shares jump 6% on Q1 pre-sales surge 5x to ₹1,100 crore

Gurugram Housing Market Shifts: ₹2.4 Cr for 1.5 BHK Apartments

Max Estates launches ₹1,200 cr residential project 'The Terraces'
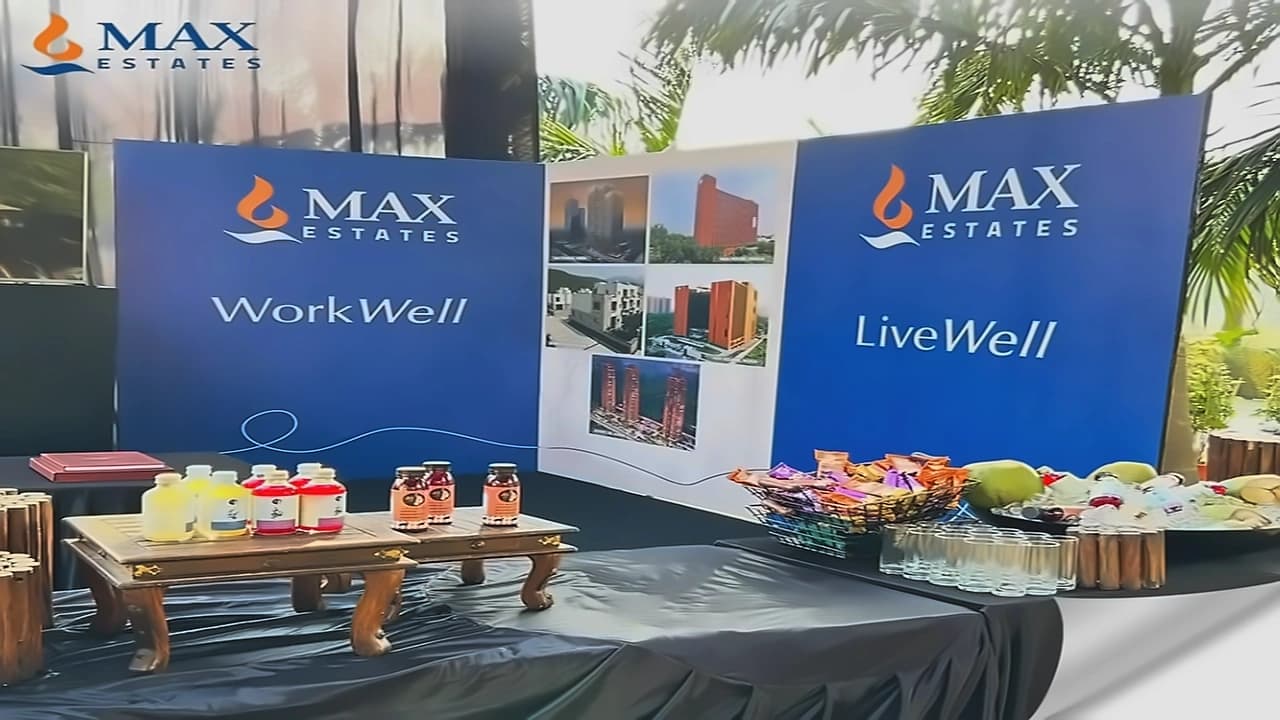
Max Estates launches ₹1,200 cr Gurugram housing project

Max Estates Q4 pre-sales hit ₹3,392cr, FY26 bookings flat

Max Estates launches Estate 105 in Noida with ₹3,000 cr GDV
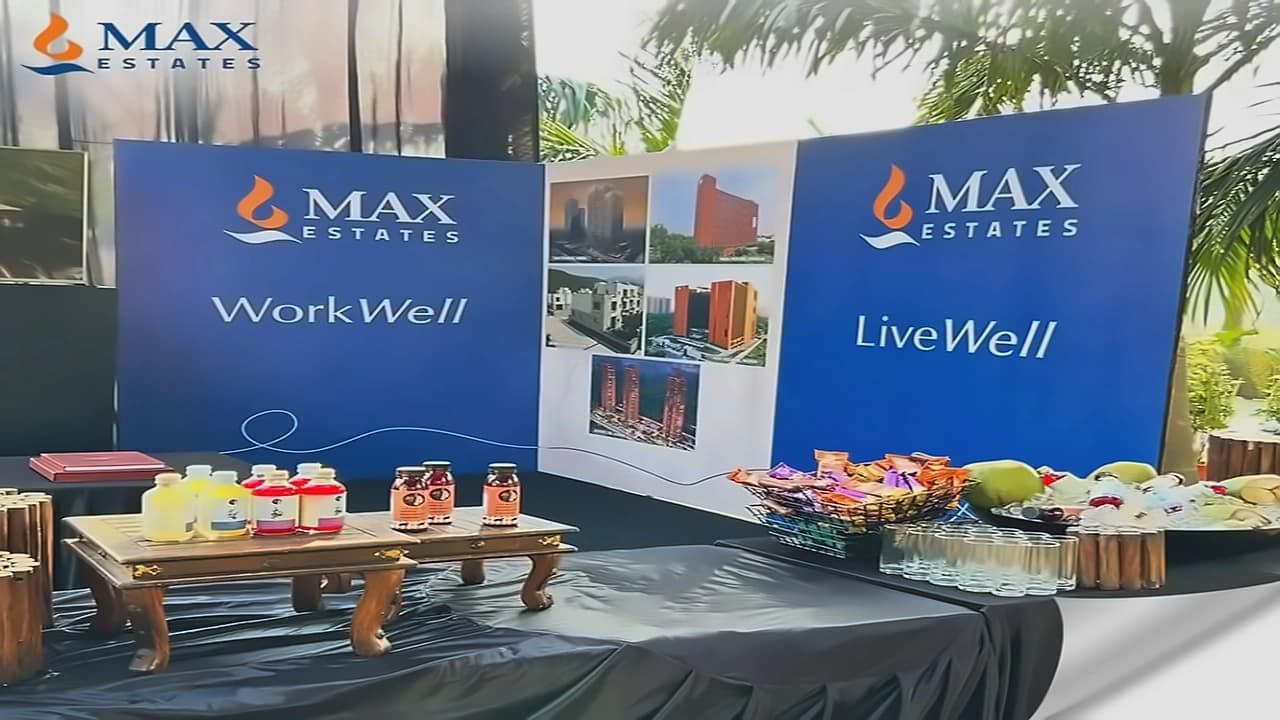
Max Estates gets RERA approval for Max One project after 9-year delay
Max Estates achieves ₹1,900+ crore pre-sales in Gurugram
The Quarter story
The two most recent quarterly results, compared side-by-side.
Max Estates maintains full commercial occupancy and scales its project pipeline, but profitability turns negative as debt and cash outflows rise.
Commercial occupancy remains at 100% from Q1 to Q3 FY26 across key assets, securing stable lease revenue.
EBITDA margin contracts from 27.2% in Q1 to -6.9% in Q4 FY26, indicating mounting cost pressures.
Social media followers grow from 6.5 in Q2 to 45.7 in Q4 FY26, reflecting strong brand visibility.
Profit after tax falls from 11.9 in Q1 to -4.3 in Q4 FY26, reflecting a shift to quarterly losses.
LiveWell partners engaged rise from 350 in Q1 to 1,100 in Q4 FY26, expanding community wellness outreach.
Cash and cash equivalents drop from 1,578 in Q1 to 205 in Q4 FY26, tightening liquidity buffers.
Head count expands from 223 in Q1 to 309 in Q4 FY26, supporting ongoing project execution.
Total debt rises from 1,406 in Q1 to 2,307 in Q4 FY26, increasing leverage amid project scaling.
New Acquisition Sector 105 GDV scales from 3,000 in Q1 to 10,000 in Q1 FY27, signaling major pipeline growth.
Website traffic plunges from 500 in Q2 to 1 in Q4 FY26, suggesting a tracking or reporting glitch.
Company insights, generated from the most recent coverage.
Cash flow negative ₹260-400 Cr in Years 1-3 (regulatory and infrastructure phase), turning positive in Year 5-6 with ₹400-800 Cr annual generation during peak sales phase.
ROE projected to surge from 2.62% to 15-21% at peak as ₹420 Cr equity unlocks ₹10,000-12,000 Cr GDV — return on incremental equity of 950-1,350% over project lifecycle.
Land cost of ₹1,000/sq ft vs industry ₹4,000-6,000/sq ft creates structural margin advantage, enabling 30-40% gross margins on West Delhi project.