The S&P 500 has reached a new record high, climbing roughly 5 percent over four sessions as the market continues its remarkable rally. However, 'Big Short' investor Michael Burry warns that the market may be approaching 'a major top' followed by a '1987-type fall', citing the record-setting performance as a warning sign. According to Georgia Fearn, Burry, who founded Scion Asset Management, remains short several major AI beneficiaries including Nvidia, Palantir, Micron, Tesla, Caterpillar, Applied Materials, and the iShares Semiconductor ETF. While six of his seven bets against these companies are profitable, he warns that the rally is creating leverage that could make the next selloff more violent.
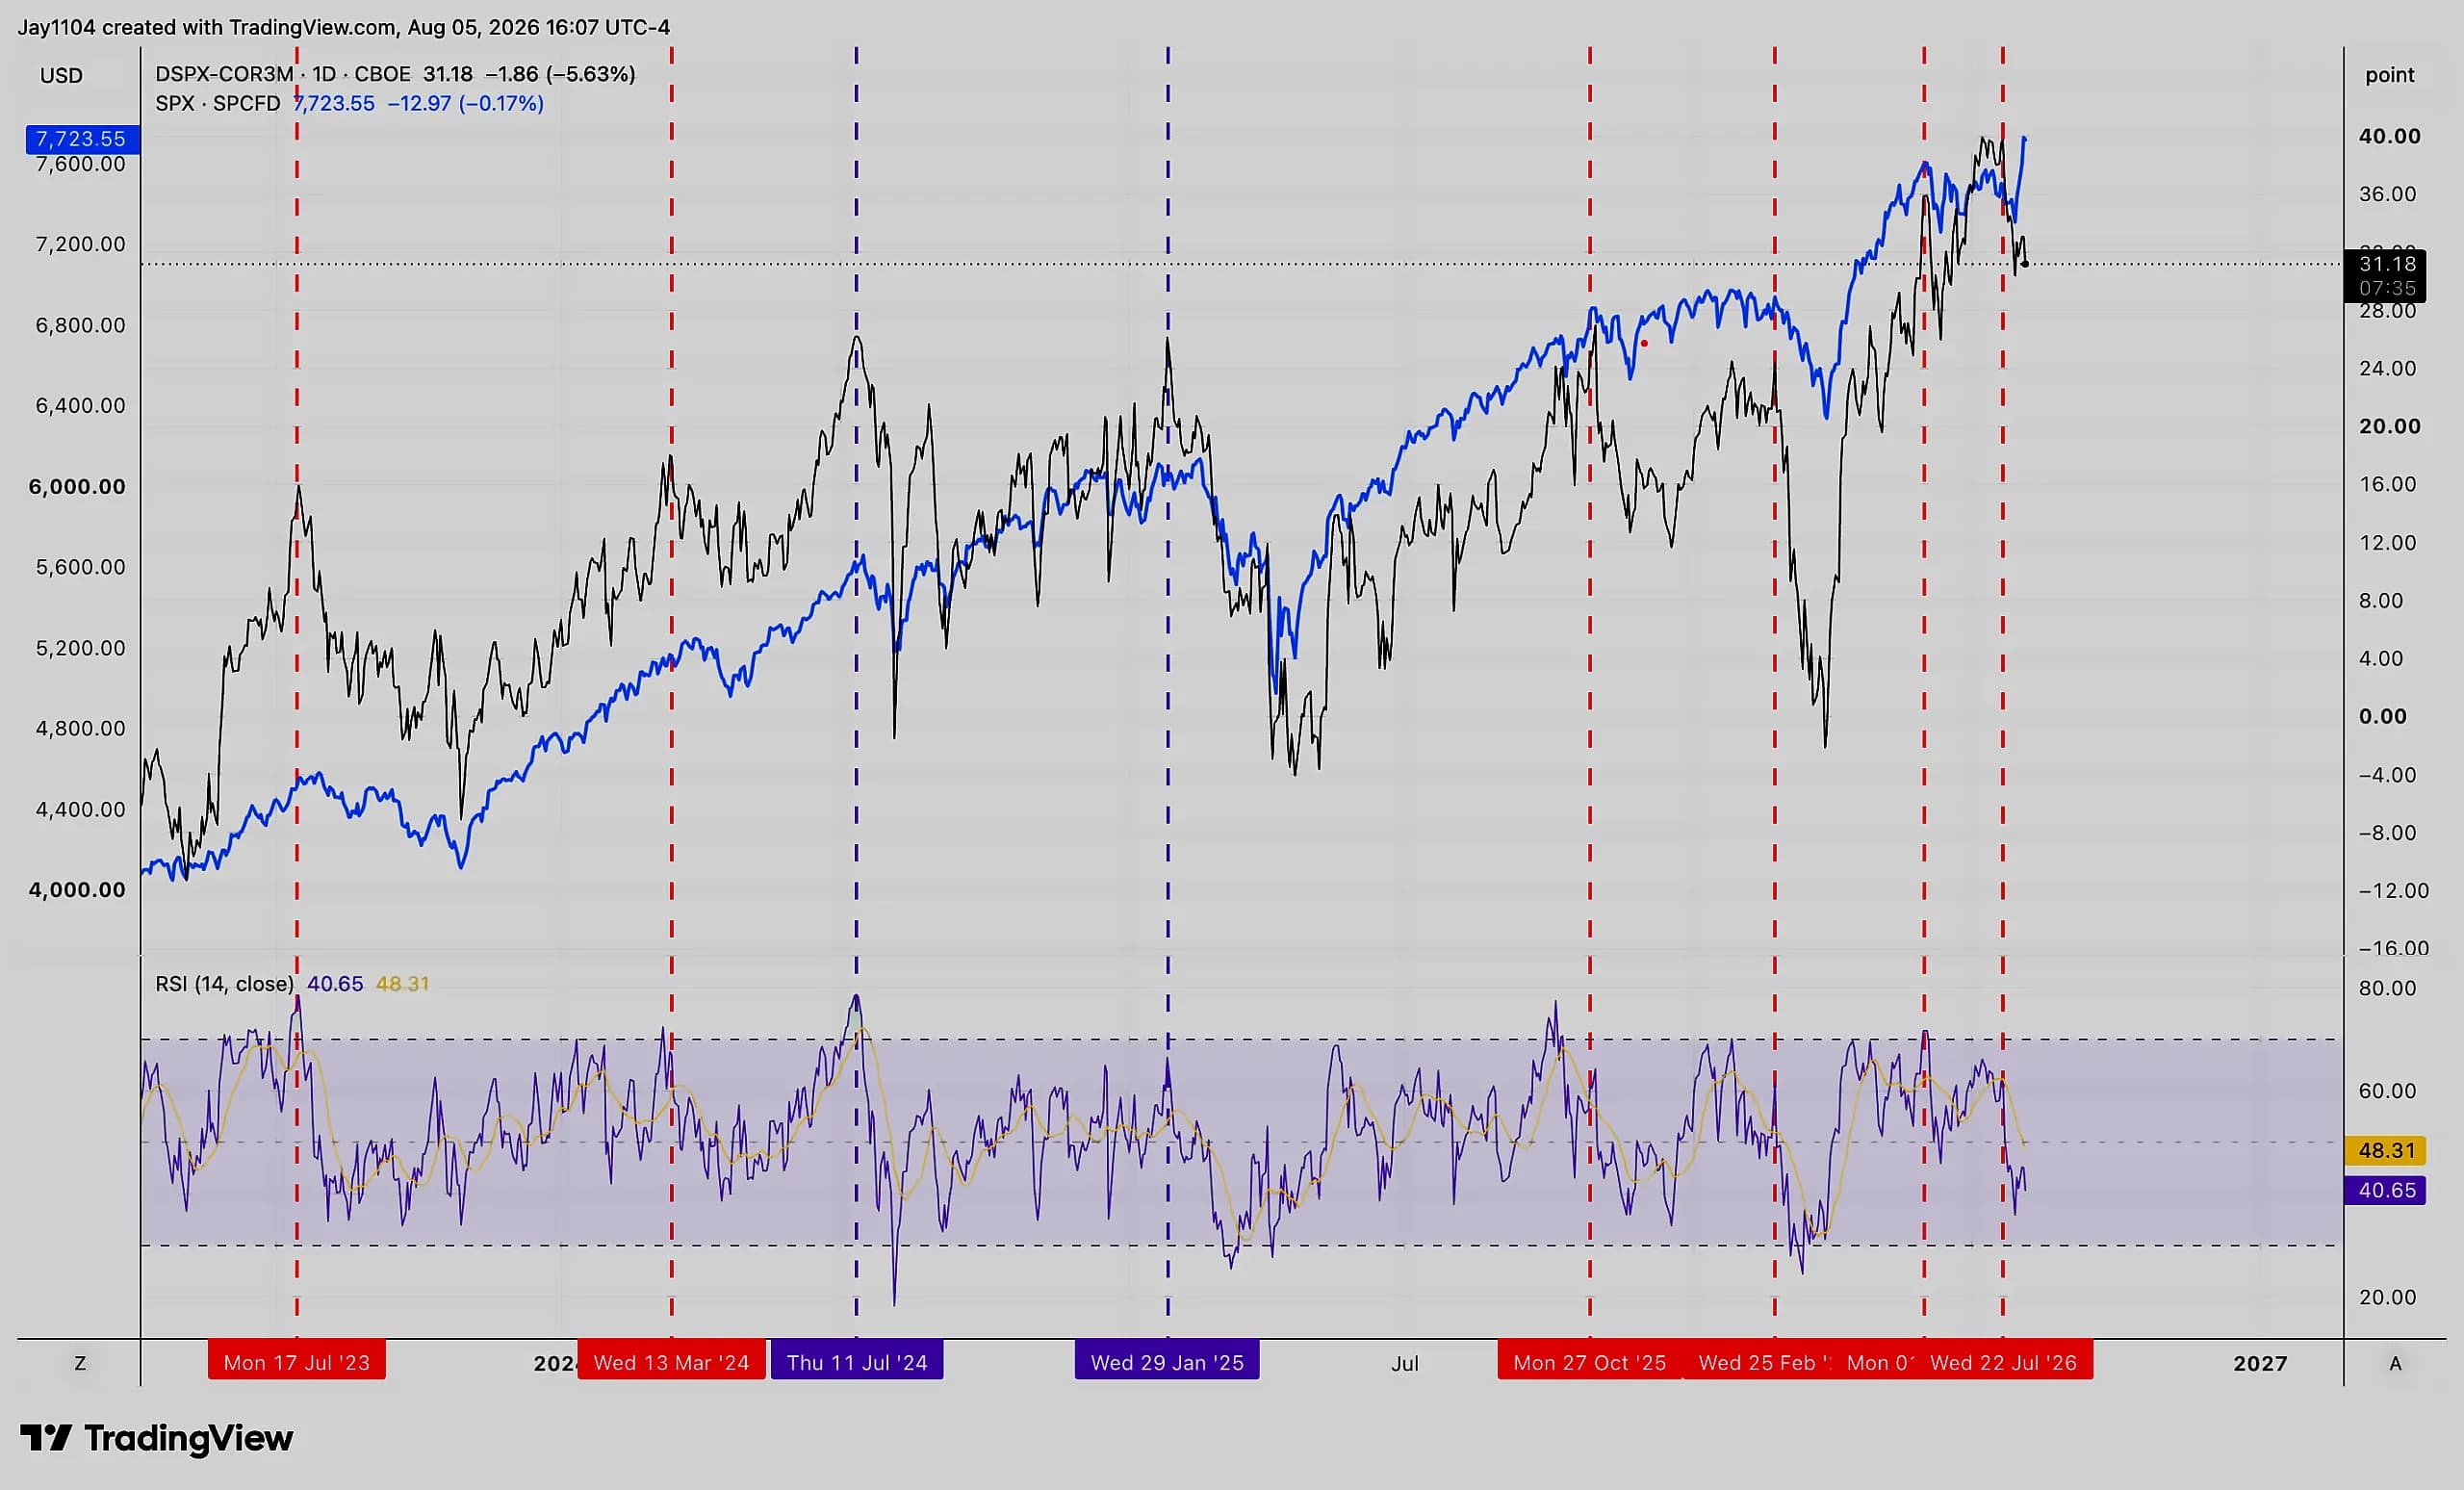
The gamma squeeze that drove the market higher earlier in the week has largely worked itself off, with call volume declining significantly on Thursday and the market stalling. As per Investing.com India, the call wall sits around 7,800 as of Friday, with plenty of gamma built up at 7,750 and 7,800, while the put wall is all the way down at 7,400. This tells analysts that if the market starts to drift lower, there is a big air pocket with not much support from an options perspective until 7,400. The Nasdaq hasn't recovered to the same degree, retracing to between the 61.8% and 78.6% levels on a closing basis, with getting through the 78.6% level usually meaning a return to highs. The gamma squeeze distorted things, though it has largely worked itself off at this point.
Bond yields rose significantly on August 6, with the 10-year yield climbing nearly 6 basis points to 4.67% and the 30-year yield rising 4 basis points to 5.21%. As per Investing.com India, the 30-year yield remains roughly 8 basis points below its recent highs, and if it can break through 5.3%, there isn't much standing in its way from a technical standpoint. The 30-year yield could move to 5.5% or even 5.85% if the current ascending triangle pattern on the weekly chart continues. This rise in bond yields adds pressure to the equity rally, particularly as the Cboe Volatility Index VIX remains around 12, which is relatively subdued given the market's record levels.
The Cboe Volatility Index VIX has fallen to around 12 from about 21 previously, following the Fed meeting and heavy earnings reports. As per MarketWatch, the advance may be more mechanical and driven by options positioning rather than an improvement in investors' fundamental outlook. Implied volatility on the VIX 1-Day was around 19.5 following the Fed meeting on the 29th, and it has come down sharply since. The VIX remains about 20 percent below its July 29 close, even after rising Tuesday, as the market continues its upward trajectory. A rapid shift in dealer gamma positioning, falling implied volatility and heavy activity in bullish call options appears to have amplified the move significantly. The trigger for the rally was the July 29 Federal Reserve meeting, which left options positioning with significant negative-gamma exposure heading into earnings reports.
10-year real yields are moving higher, now at 2.43%, up about 70 basis points since early March, though not as large as the nearly 1.5% rise from April 2023 into October. According to Investing.com India, the 10-year real yield is now trading above the 10-year breakeven inflation expectation, something that hasn't happened since 2007, which suggests that for the first time in two decades, the market is doing some of the work for the Fed in tightening policy. This preceded the housing bubble popping in July of 2007, right before the market ultimately peaked. It may only take another 10 or 20 basis points, to roughly a 90 basis point move, before impacts start showing up, with history suggesting the market reacts with a delay. The dispersions trade unwind continues as we enter the part of the year when single-stock implied volatility rises sharply heading into earnings.