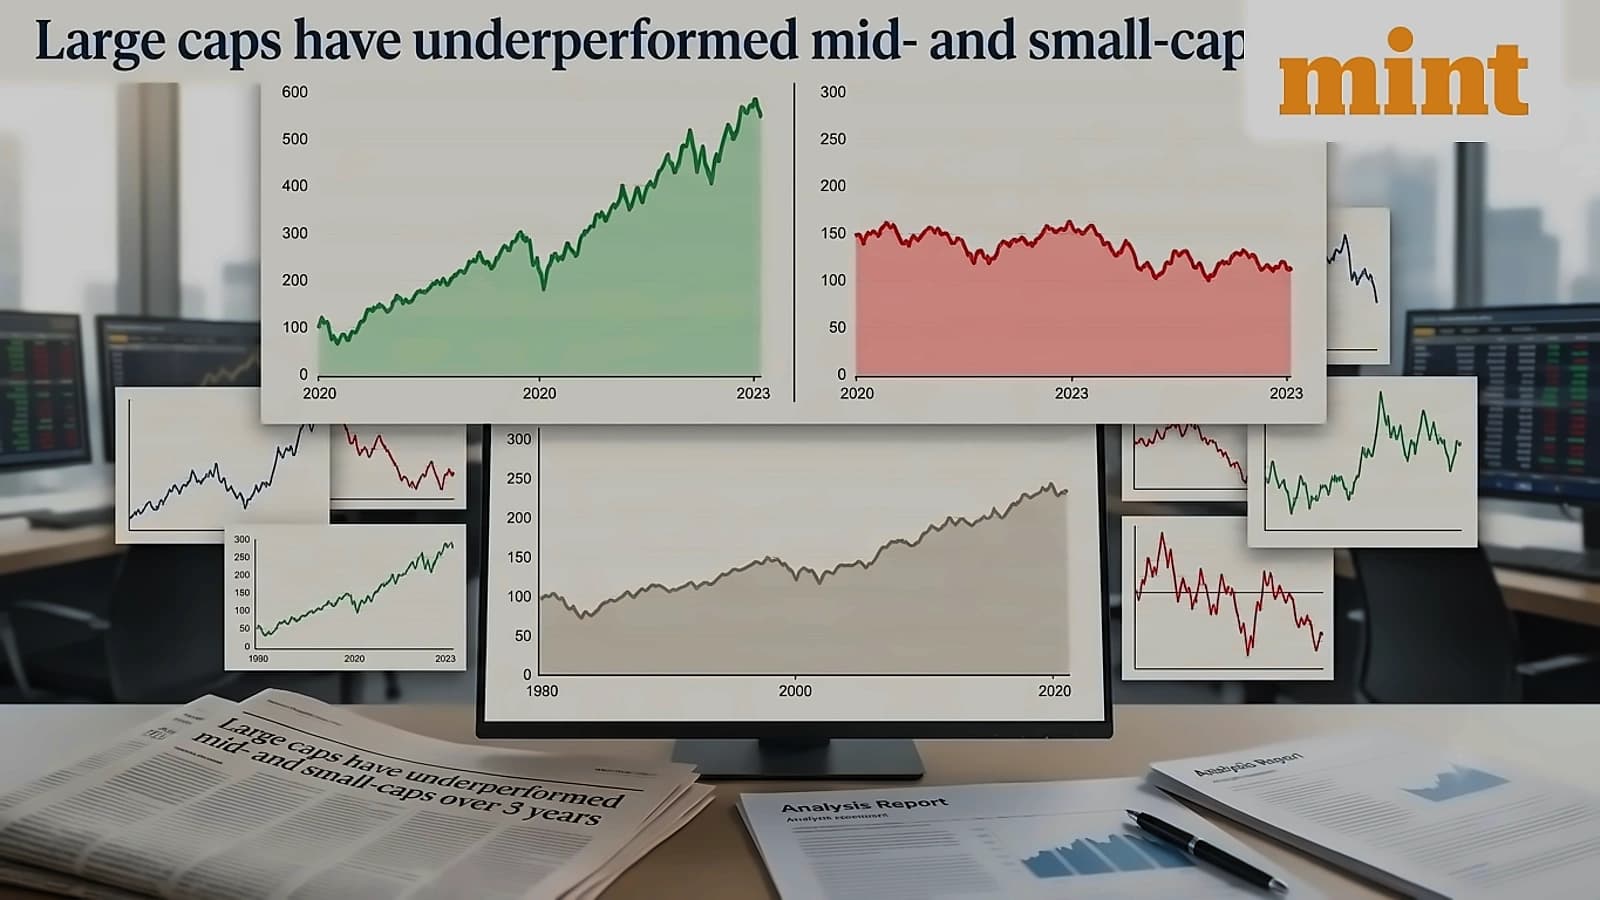
The broader market indices have achieved their highest outperformance versus Nifty 50 in 2026, with the Nifty Midcap 100 and Nifty Smallcap 100 delivering exceptional returns of 14.03% and 20.36% respectively compared to the benchmark index. According to Business Standard, this outperformance is most pronounced at peak levels, where mid-caps have outperformed by 14 percentage points and small-caps by 21 percentage points in calendar year 2026. As of August 31, 2026, an investment of ₹100 in each of the three indices would be worth ₹92.16, ₹106.18, and ₹112.52 respectively, demonstrating the significant value creation in smaller market segments. The Nifty 50 has declined 7.8% thus far in 2026, highlighting the stark contrast in performance across market capitalizations. Recent market data shows 94 stocks hit 52-week highs on Tuesday, up sharply from 35 on Friday, as mid- and small-cap stocks continue to outperform the Nifty50, with the Nifty50 remaining about 9% below its all-time high.
September historically favors mid- and small-cap stocks over large-caps, with analysts expecting this trend to continue in the current month. According to The Economic Times, over the past 10 years, the Nifty 50 and Nifty 500 have risen in five Septembers each, with average losses of 0.27% and 0.17% respectively, while the Nifty Midcap 100 and Nifty Smallcap 250 advanced in seven out of the past 10 Septembers. Sriram Velayudhan, senior vice-president at IIFL Capital Services, noted that "September seasonality has generally favoured small-caps and mid-caps, while large caps have delivered mixed returns, and we see a strong probability of this trend continuing into the month ahead." The Nifty fell 0.4% to end August at 24,080.4, with the NSE benchmark declining 1.2% during the month, while the Nifty Midcap 100 climbed 2.1% and the Nifty Smallcap 250 gained 2.5%.
The exceptional outperformance of mid- and small-cap indices is primarily attributed to significant changes in their constituent composition compared to the Nifty 50. According to Business Standard, around 40% of Nifty Midcap and Smallcap constituents changed over the last two years, with roughly 20% changes in the last year, while the Nifty 50 index saw just six changes in two years and two in one year. As noted by Nandish Shah, technical research analyst at HDFC Securities, "Around 40 per cent of the Nifty Midcap and Smallcap constituents changed over the last two years, with roughly 20 per cent changes in the last year, in comparison, the Nifty 50 index saw just six changes in two years, and two in one year." The analyst adds that stocks performing well tend to enter the broader indices, while those underperforming are removed, creating a self-reinforcing cycle of outperformance in these segments.
NIFTY India Defence emerged as the top sectoral gainer, hitting fresh record highs by soaring over 4.1% in August with a broad-based rally where 16 out of the 19 stocks in the index closed in green. MTAR Technologies led the rally with a 20% gain, followed by Paras Defence (+17%) and Dynamatic Technologies (+15.9%). Meanwhile, NIFTY Metals soared over 3.7% amid optimism around global metal prices, with Welspun Corp surging over 44% in the previous month and standing as the top gainer. Steel Authority of India (+16.8%), APL Apollo Tubes (+16.5%), and Hindustan Zinc (+13.2%) were among the key gainers from the metals index. On the flipside, NIFTY FMCG stood as the top sectoral loser, shedding 6.3% in August and hitting six-month low levels, with 14 out of the 15 index constituents closing in red.
The Nifty has entered a consolidation phase after declining through most of August, with the index currently holding near the 50-day moving average (50-DMA). According to reports from The Financial Express, this consolidation phase has resulted in lacklustre trading on most days in the last week. While the index is supported by the 50-DMA, sectoral indices appear positioned differently, with most major Nifty indices including Auto, Bank, Energy, Financial Services, FMCG and PSU bank slipping below the 20-day SMA, with FMCG being the farthest at 3.15%. The S&P BSE Midcap index has shown remarkable resilience, trading 1.16% up at 14,383.11 on September 7, with several midcap stocks crossing their 20-day Simple Moving Averages (SMA). From a technical perspective, analysts expect the outperformance to continue, with Nandish Shah from HDFC Securities noting that "Midcap and smallcap indices look technically strong on the charts, and the outperformance may continue for the next one year, while Nifty may remain tepid." However, market breadth analysis reveals concerning trends, with more than a quarter of stocks in the Nifty Smallcap 100 and Nifty Midcap 100 index now deep in bear market territory, defined as falling more than 20% from recent highs, despite the overall trend remaining positive.