


The Nifty 50 index surged 1.74% on November 5, 2025, opening at 24,378.05 points with a gain of 417.45 points from the previous close. The Sensex also demonstrated strong performance, opening 1,609.54 points higher at 78,910.94 points, representing a 2.08% increase. According to market reports, the rally was primarily driven by an overnight plunge in global crude oil prices and strong momentum following massive net foreign institutional buying in the previous session.
The sharp fall in crude oil prices offers the clearest economic explanation for the market rally. Brent crude, a widely followed international oil benchmark, settled at $94.62 per barrel on November 4 after falling 8.7%. It slipped further to around $93.65 in early trading on November 5. The decline followed the US midterm election results, which raised hopes that Washington might pursue an end to the conflict with Iran. Investors began anticipating a lower risk of further disruption to oil supplies, though an election result does not itself settle a conflict or guarantee cheaper oil.
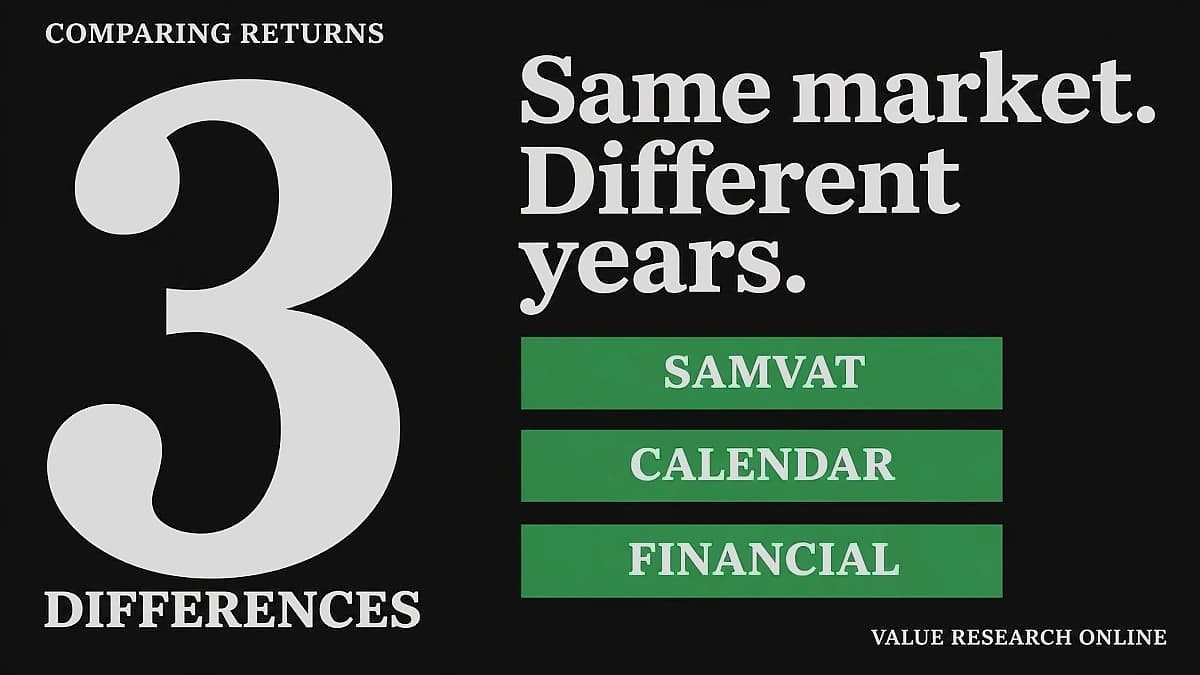
The Nifty 50 index demonstrated contrasting performance across different time measurement periods in 2025. According to market reports, the index rose 10.5% during the calendar year 2025, indicating positive momentum for investors. However, the FY26 performance showed a decline of 5.1%, suggesting a different investment trajectory when measured from the financial year perspective. The latest rally on November 5 shows continued volatility in market performance despite the positive oil price developments.
The market rally was significantly supported by massive net foreign institutional buying in the previous session, as reported by market analysts. Investors were responding to the possibility of lower costs for businesses and less pressure on India's economy from the cheaper oil prices. The question now is how much of that relief will reach company profits, as share prices can reflect that benefit well before businesses actually receive it. A cheaper barrel of oil can improve the outlook, but the sustainability of these gains depends on actual corporate earnings improvements.
Understanding the three different return measurements - Samvat (lunar calendar), Calendar Year, and Financial Year - can help investors make more informed decisions. The varying performance across these time periods provides a comprehensive view of market dynamics and allows investors to evaluate their investment strategies based on different performance metrics. This framework enables investors to analyze market trends and make strategic decisions based on the most relevant time measurement for their investment objectives, particularly as markets respond to global oil price movements and foreign investment flows.