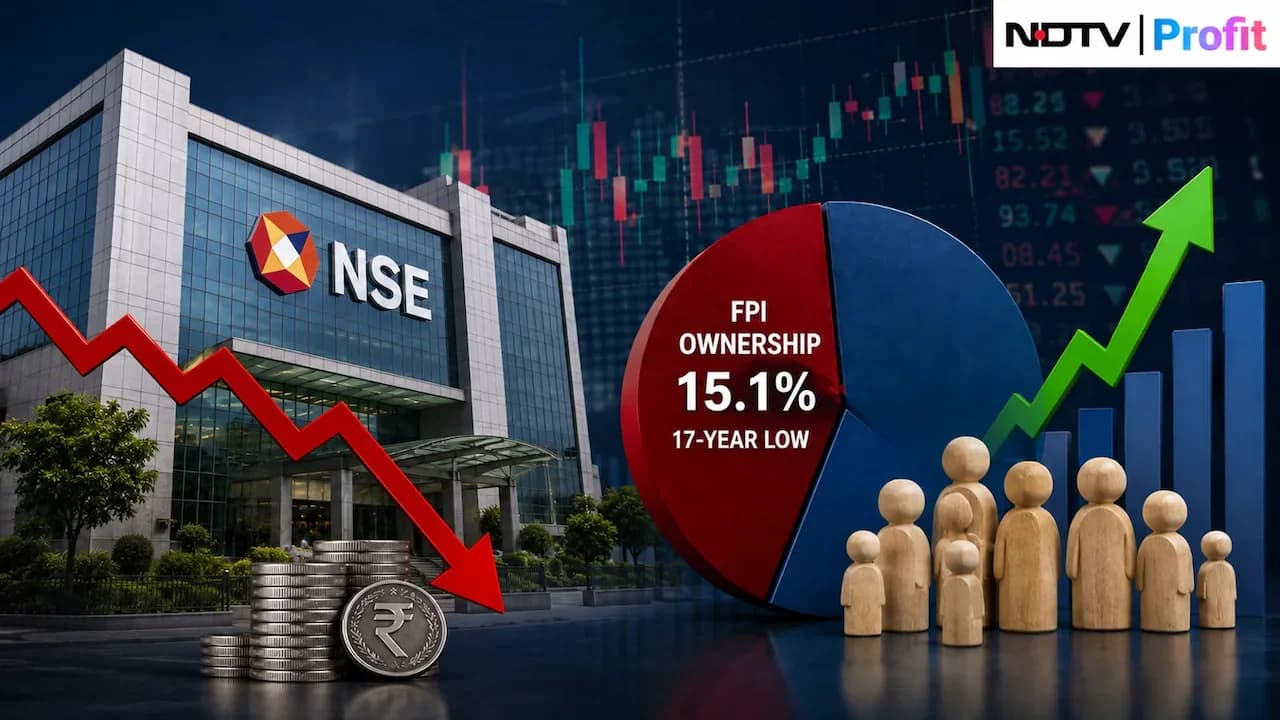
Foreign portfolio investor (FPI) ownership in Indian equities declined to 15.88% in the June quarter, marking its 14-year low according to the latest PRIME Database Group data. This represents a significant decline from 16.12% in the previous quarter and 16.71% in September 2025. The decline came amid record quarterly FPI outflows of ₹1.43 lakh crore in the first quarter of FY27, comprising ₹1.53 lakh crore in secondary market outflows, partially cushioned by ₹10,096 crore in primary market inflows through IPOs and other offerings. FPIs sold Indian equities worth ₹1,43,150 crore, or around $15 billion, during the April-June quarter. As per Business Standard, between October 2024 and June 2026, more than $50 billion, or roughly ₹4.5 trillion, was withdrawn by foreign investors from Indian equities, with the most dramatic period being March 2026 when FPIs sold about ₹1.18 trillion during US-Israel attacks on Iran.
In contrast to the FPI decline, domestic mutual fund ownership rose for the 12th consecutive quarter to a record 11.58%, taking overall Domestic Institutional Investor (DII) ownership to 28.66% when combined with retail and HNI investors. DIIs have now maintained a higher share of the Indian equity market than FPIs for seven consecutive quarters, a position last seen in 2003. The report also showed that direct individual ownership increased to 9.5%, while the combined ownership of individuals through direct holdings and mutual funds reached a record 19.3%. As per Business Standard, between October 2024 and July 2026, roughly ₹6.31 trillion entered mutual funds through systematic investment plans (SIPs), with SIPs still bringing in ₹31,961 crore in July 2026, almost touching an all-time high. In July 2026, actively managed equity mutual funds received about ₹24,697 crore of net inflows, with smallcap and midcap funds alone accounting for ₹13,960 crore, or about 56.5% of equity mutual-fund inflows.
Promoter ownership in NSE-listed companies increased to 41.36% in the June quarter, marking a 2-year high according to the latest data. Total promoter shareholding in NSE-listed and Nifty 50 companies rose for the second consecutive quarter, increasing by 21 basis points and 19 bps quarter-on-quarter respectively. In value terms, promoter holdings in NSE-listed companies increased by a sharp 15.2% QoQ to ₹235 lakh crore, reaching a seven-quarter high and the strongest sequential increase in promoter holdings in 22 quarters. The increase was driven by higher holdings of private Indian and foreign promoters, with private Indian promoter ownership rising by 29 bps to 32.1% and foreign promoter ownership increasing by 28 bps QoQ to 30.7%.
The NSE report highlighted a continued shift in institutional portfolios away from the largest companies. Banks, financial institutions and insurance companies continued to have the highest concentration in Nifty 50 stocks but their allocation declined by 2.5 percentage points QoQ to 62.6%, a fresh all-time low. FPIs reduced their exposure to large-cap stocks even more sharply, with the share of Nifty 50 companies in their portfolios declining by 3.6 percentage points QoQ to an all-time low of 57.4%. Domestic mutual funds also cut their allocation to Nifty 50 stocks by around 3 percentage points QoQ to 51.4%, the lowest level in more than 18 years. Their Nifty 50 exposure is now 11.6 percentage points below the December 2019 peak of 63%. As per Business Standard, the top 100 companies received 76% of FPI investment, though this was down from 83% in December 2022, while company ownership ranked 251-500 has barely budged from 5% to 6%. Meanwhile, the Nifty Smallcap 250 index has doubled since March 2023, and the Nifty Microcap index is up 150%.
The data points to a continued broadening of institutional portfolios beyond India's largest listed companies, alongside a sustained increase in the influence of domestic investors in the Indian equity market. The shift reflects changing investment preferences and market dynamics, with domestic institutional investors now playing a more prominent role in shaping market movements compared to foreign portfolio investors. According to PRIME Database's analysis, this represents a sustained, multi-year rebalancing of Indian equity ownership rather than a temporary blip, with the FII vs DII gap narrowing steadily from its widest historical level of 21% in March 2015 to current levels. The structural shift is driven by monthly SIP inflows above ₹31,000 crore growing at double-digit rates year-on-year, representing a genuine shift in how ordinary Indian households allocate savings toward equity mutual funds. As per Business Standard, India needs almost $100 billion in net foreign direct investment (FDI), mostly in manufacturing, which would bring in technology, create skills and jobs, and convert India's domestic scale into internationally competitive production lines.