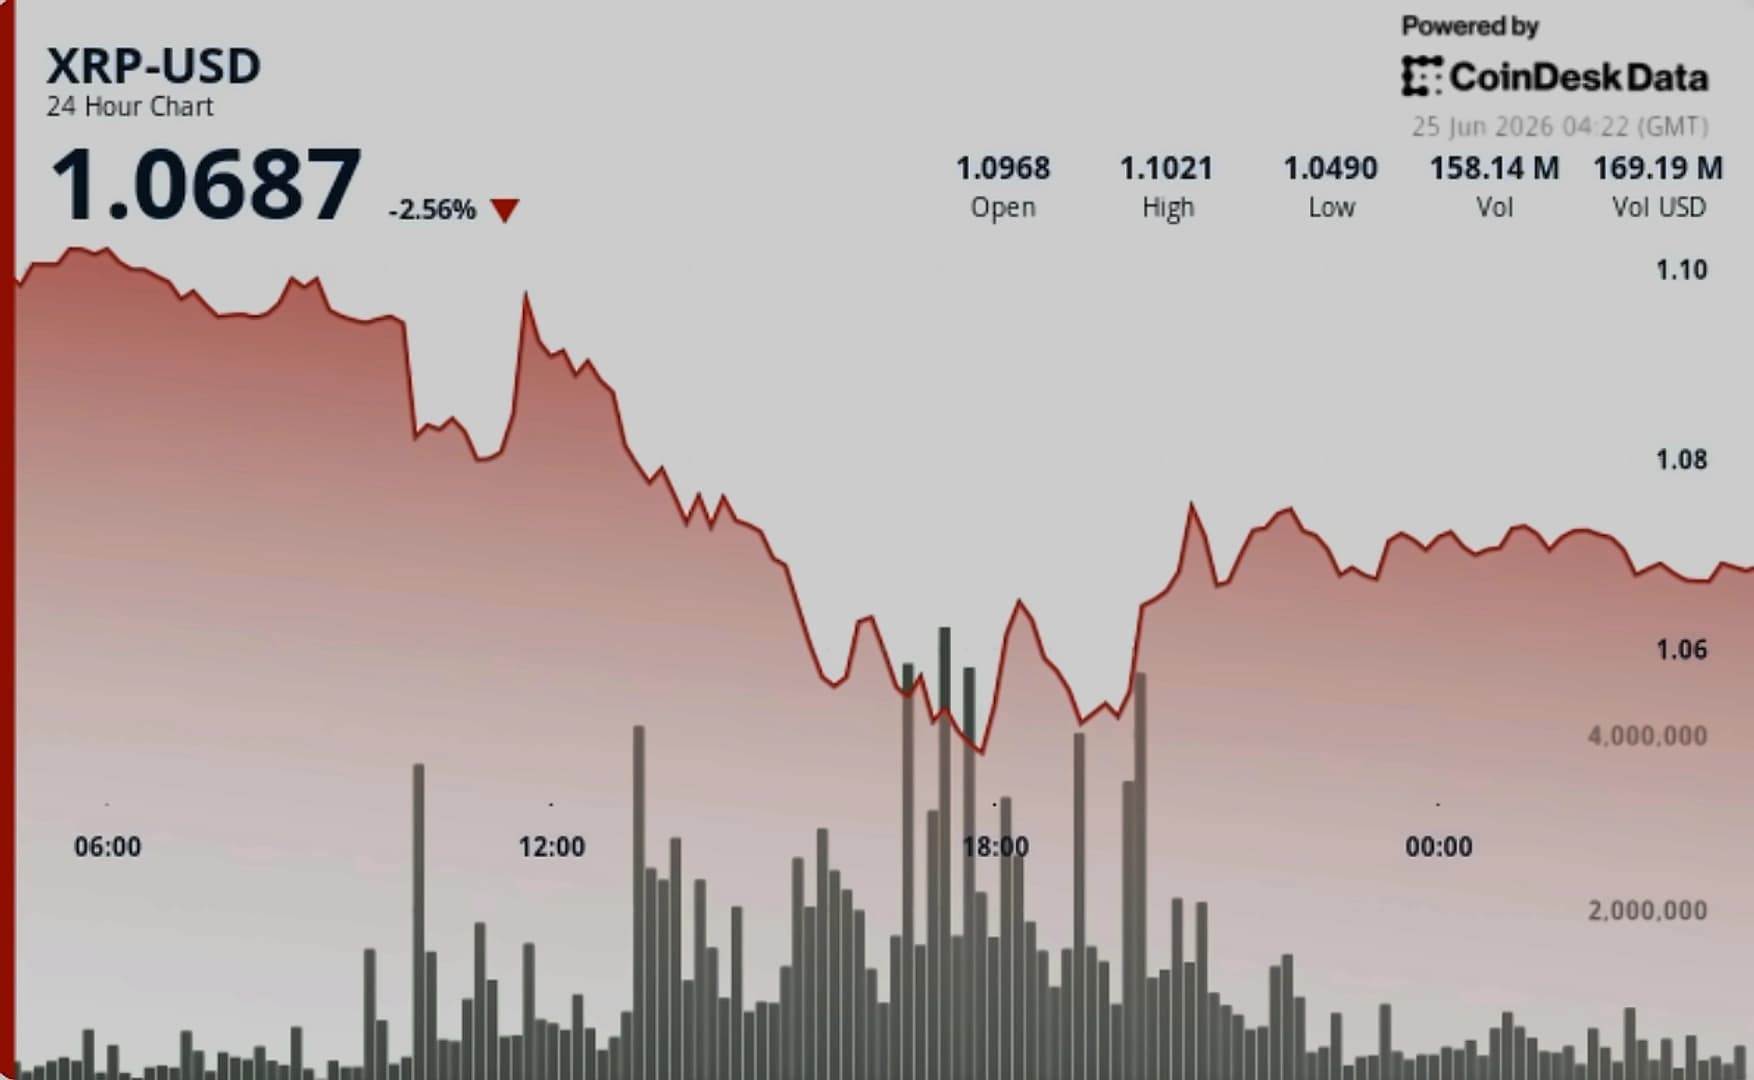
XRP is testing historic oversold levels on the weekly RSI, echoing the 2022 bear-market bottom for only the second time in the token's history. According to Cryptoinsightuk, the signal was previously aligned with one of XRP's strongest recoveries, drawing fresh attention from contrarian traders. XRP is currently trading around $1.07, down sharply in recent sessions, with the 24-hour decline exceeding 3% and weekly losses stretching to roughly 10%. The token's market cap has dropped to approximately $66.2 billion, though it remains among the top cryptocurrencies globally by total value. The historical parallel matters significantly, as in late 2022, the same technical setup coincided with XRP's capitulation low near $0.29, which ultimately marked the cycle trough before a substantial recovery. However, analyst CryptoSensei cautions that "Second time in history touching this zone is wild. Not saying it has to be the bottom, but this is definitely where I stop listening to panic takes."
The market structure has deteriorated significantly from earlier this year, when XRP collapsed from near 1.94 toward the 1.11 low. Since then, price action has become far more volatile, with buyers repeatedly defending dips around the 1.30–1.35 zone before the recent breakdown. XRP is now testing key support near $1.08 within a falling wedge pattern that has developed since the June 16 high near $1.28. The pattern consists of converging downward-sloping trendlines and often precedes bullish reversals when selling momentum begins to weaken. Price action has already reached the lower boundary of the wedge near the $1.08 area, a level that also aligns with a key Fibonacci support zone. A breakout above the upper trendline could expose resistance levels at $1.13, $1.16, and $1.19, with the 50% Fibonacci retracement level sitting near $1.189 and the 61.8% retracement level around $1.214. However, momentum indicators remain mixed, with the four-hour MACD below the zero line showing sellers still control short-term momentum, while the Chaikin Money Flow remains negative at approximately -0.13, indicating capital continues to leave the market. Technical analysis shows seller momentum at its peak with the Stochastic Momentum Index (SMI) oversold at negative 76, while the RSI Divergence indicator bounced from oversold territory with a reading of 36.
Despite the price weakness, XRP is maintaining significant trading activity with nearly $17 billion in weekly volume over the past seven days, even as the price fell more than 11% during this period. As reported by CoinGlass, this volume figure is particularly telling, as assets that are genuinely losing relevance don't sustain this kind of participation. Daily volume remains robust at $1.5 billion, showing that something underneath the surface is keeping participation elevated even as price slides. The current price action is grinding through one of its less flattering stretches, hovering around $1.08, with the token down by around 3% today but still showing strong underlying engagement. This volume data pushes back against relevance concerns, as it indicates that attention is still there, the bid just isn't chasing it right now. The $3 billion daily average demonstrates this isn't a liquidity vacuum, though volume alone doesn't reverse a trend direction. CoinGlass liquidation data shows one of the largest concentrations of leveraged positions sitting between $1.13 and $1.15, with the strongest liquidity cluster located near $1.14, which has emerged as a potential short-term magnet should buyers trigger a recovery from current support. Recent whale activity shows significant positioning, with a whale opening a 20x leveraged long of more than 27.924 million XRP, worth well over $30 million on HyperliquidX, alongside buying about 810 BTC with the same leverage, valued at $50.60 million. These positions suggest potential bullish reversal as the two cryptos maintain a Correlation Coefficient of 0.68.
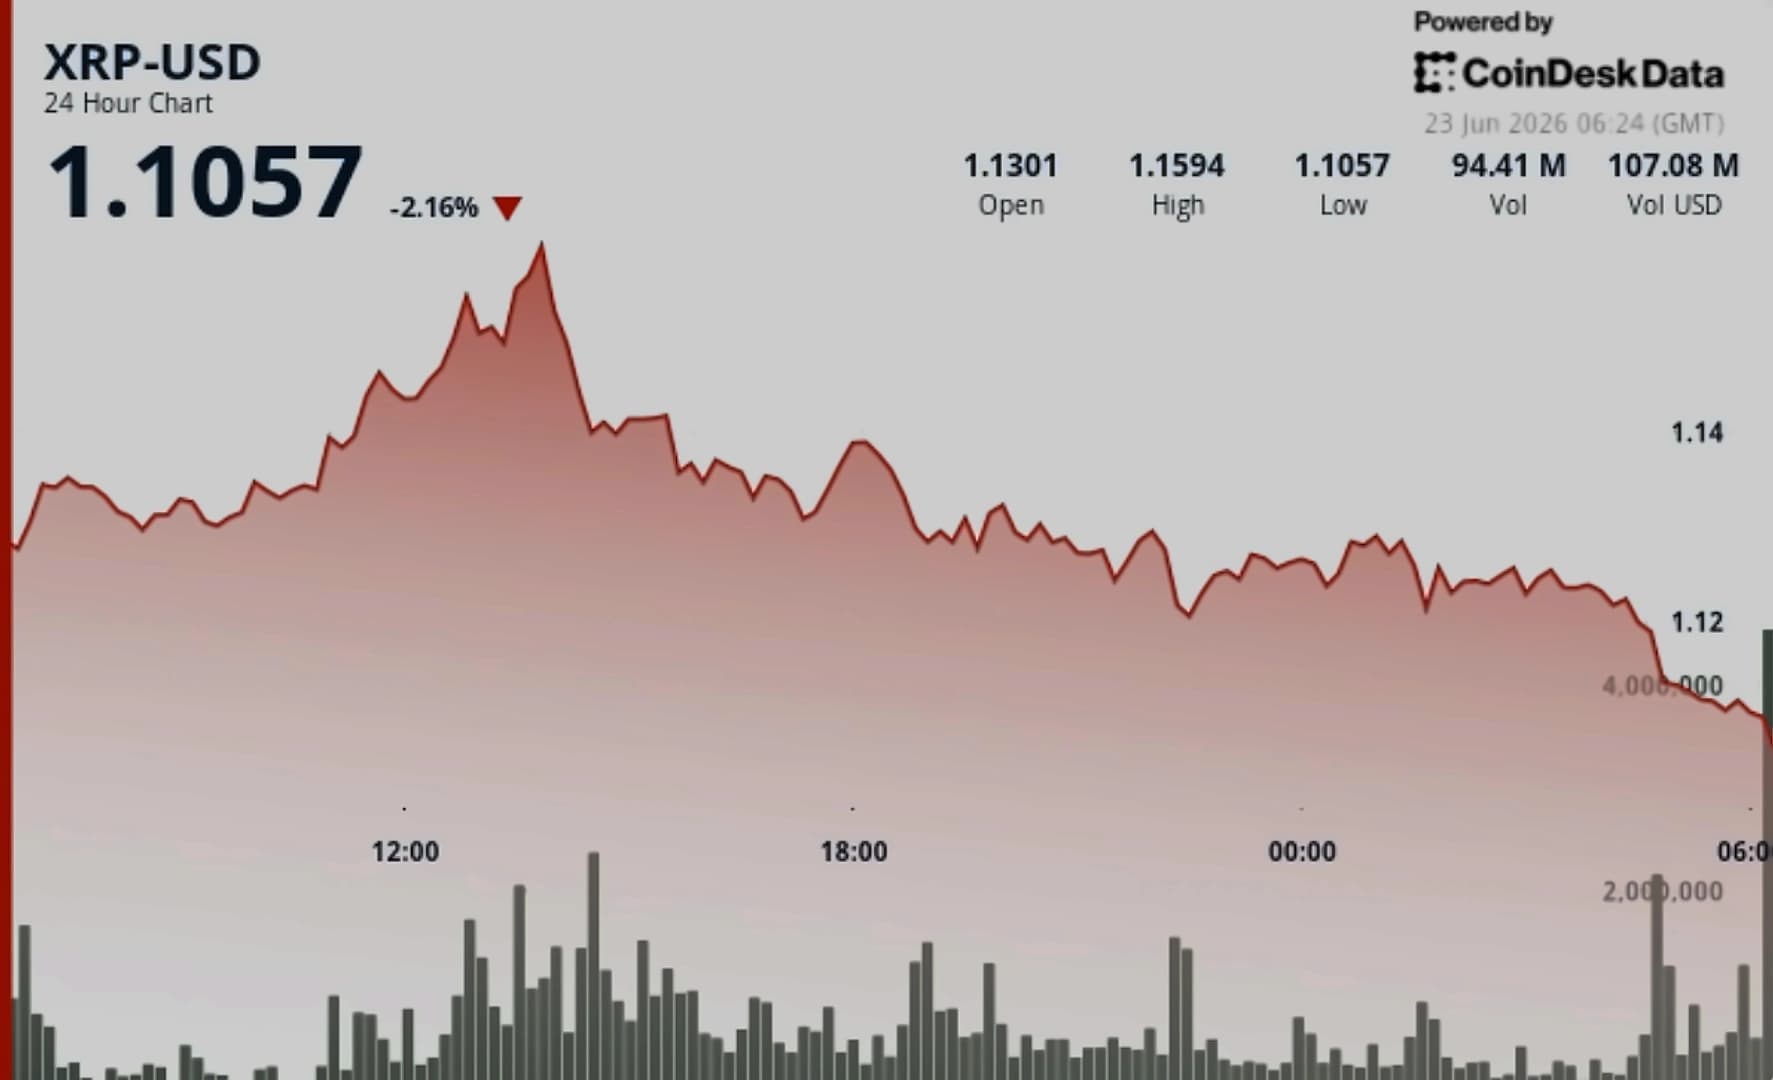
The pullback coincided with renewed pressure on Bitcoin, which briefly fell below $62,000 during the latest market correction, and broader risk appetite weakness across crypto markets. Rather than extending the rally, traders used the announcement as an opportunity to lock in profits after Ripple secured preliminary approval under Europe's Markets in Crypto-Assets framework through Luxembourg, a development that grants passporting rights across the European Economic Area. Market sentiment has struggled to recover after several weeks of capital rotation toward artificial intelligence and semiconductor stocks, while elevated borrowing costs have limited speculative flows into digital assets throughout the second quarter. XRP dominance has been declining since mid-2025, with the metric trading at 3.23% compared to 5.50% in mid-2025, showing signs of continuation and trading at the apex of a descending triangle. This metric is about to break out as compression rarely lasts and is followed by expansion, potentially attracting capital back to the XRP ecosystem. The daily chart presents a more challenging picture for bulls, with XRP remaining below its daily Supertrend resistance near $1.24 and continuing to trade under a sequence of lower highs that has been in place since mid-May.
Current price action shows XRP oscillating in the $1.08–$1.14 range, a zone traders are treating as a short-term pivot. The weekly chart shows XRP's momentum clearly weighted to the downside in the near term, with the $1.00 psychological support being the key level to watch. A decisive break below $1.08 could expose psychological support at $1.05 and increase the risk of a deeper move toward the $1.00 level. However, the strongest bearish path needs Bitcoin to continue falling and pull XRP down to a daily close below $1.08, as the token is more likely to bounce than break lower in the next week or two. A move into the $1.14 region could force short liquidations and accelerate a relief rally, with the $1.13-$1.15 liquidation clusters providing potential support. To the upside, $1.20–$1.25 represents the first meaningful resistance cluster, while reclaiming that zone on volume would be the clearest short-term bullish signal. However, continued weakness in Bitcoin, another hawkish shift from the Federal Reserve, or a resurgence in geopolitical tensions could add further pressure to XRP and delay any recovery attempt. The sideways market structure since February between $1.28 and $1.55 has broken down, with XRP confirming the breakdown through a retest but yet to surpass the previous low, suggesting potential for either further decline or a bullish reversal depending on broader market behavior. Traders are now watching two specific signals for confirmation: a decisive weekly close above the 50-week moving average would offer the first technical green light, while an RSI divergence would strengthen the case for a sustained bottoming process.