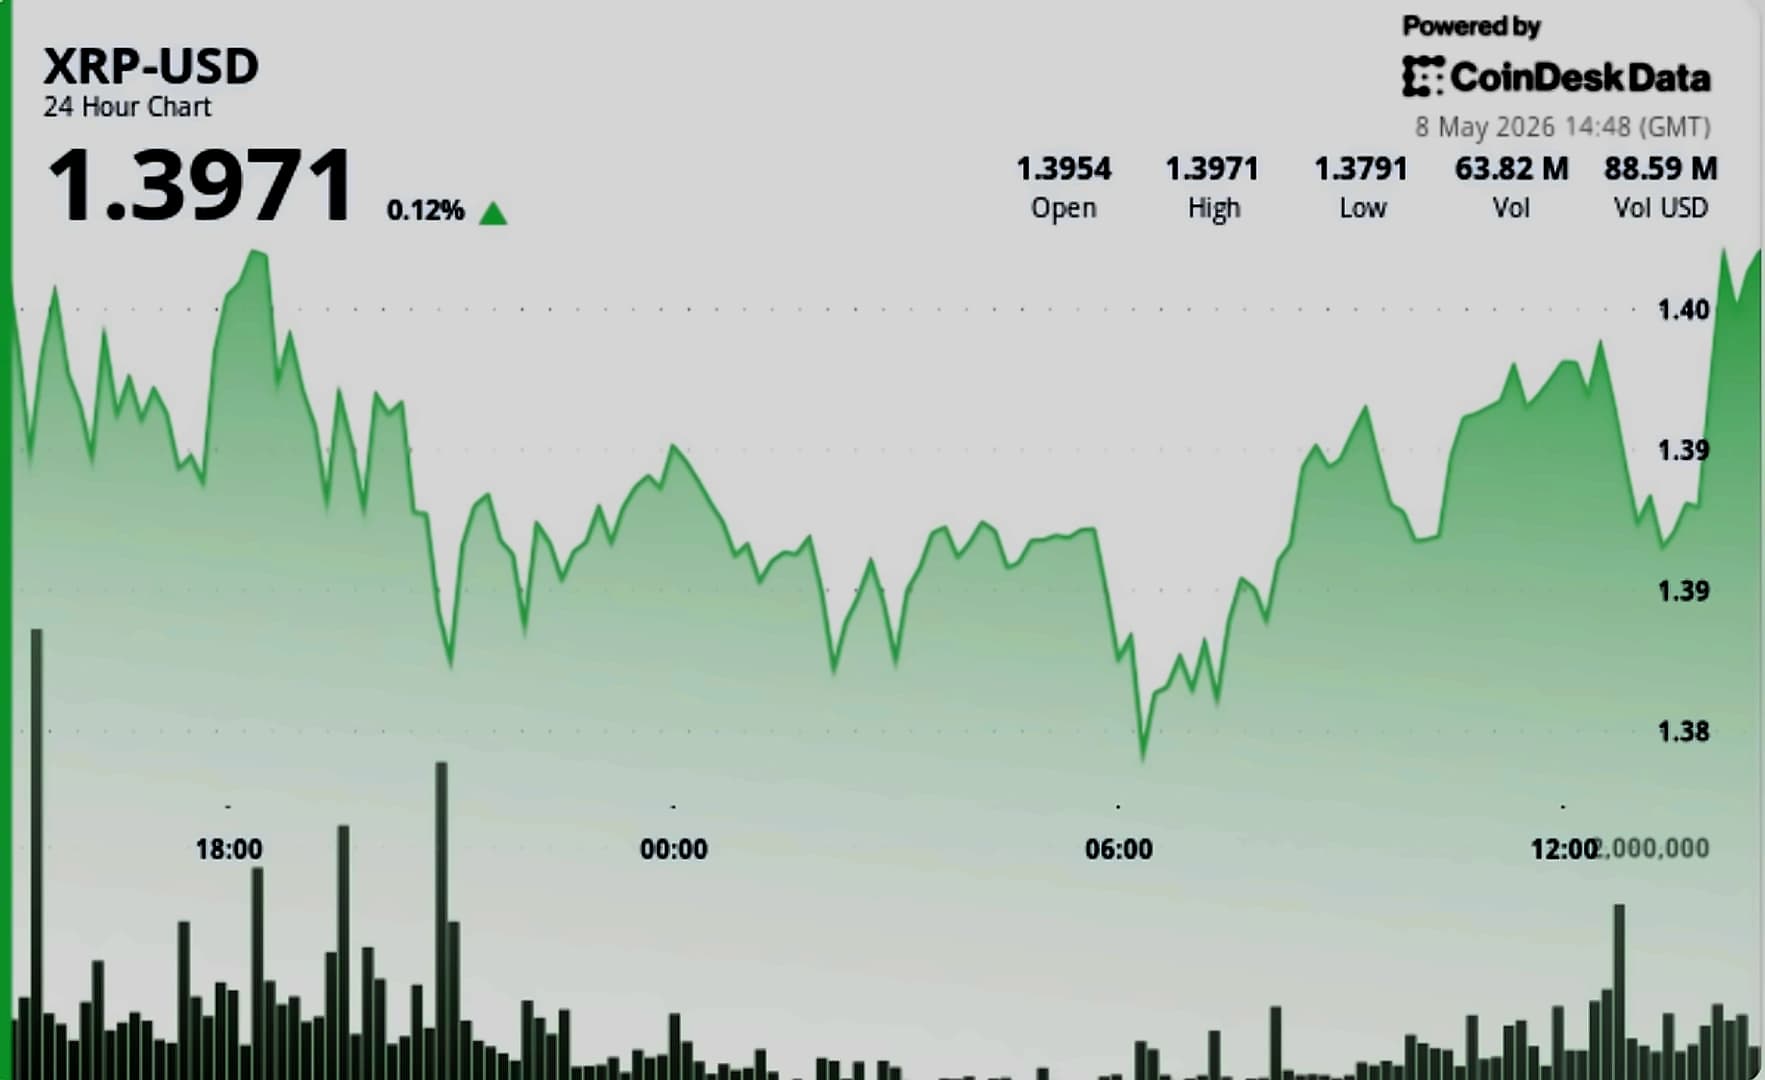
XRP is currently facing significant downside pressure as it rejected $1.50 for the second time in three weeks, drawing a textbook double top pattern. The cryptocurrency has rejected the same resistance level twice - first at $1.50 on April 17 and again at $1.51 on May 10, with both tests resulting in sharp pullbacks. According to technical analysis, the double top structure warns that buyers have lost momentum, with the pattern confirming only if the neckline breaks, which sits well below the current price. The 12-hour chart shows a double top pattern where price tests the same resistance twice and fails to break through, confirming that the rally back near $1.50 was a relief bounce rather than a trend change.
Beneath the price action sits a second bearish signal - hidden bearish divergence appeared on the daily RSI between mid-February and May 10. The XRP price made lower highs while RSI made higher highs, with the RSI being a momentum oscillator that measures the speed and magnitude of price changes. Hidden bearish divergence in a downtrend typically confirms continuation rather than reversal, aligning with the double top pattern. XRP is up 7.5% over the past 30 days but still down 21% year to date, with the larger trend remaining bearish which the divergence confirms. The combination of these technical signals suggests the current rally may be unsustainable without a clean break above the double top resistance.
While the chart turned bearish, derivatives positioning went the opposite way with XRP open interest surging from $798 million on April 29 to $940 million on May 11, representing $142 million in new longs over the same window. The XRP funding rate jumped from 0.000503% on April 29 to 0.006%, a 12-fold increase, indicating strong positive funding signals and crowded leverage. However, this combination is unusual as bulls are leveraging up at the exact moment the chart is showing classic distribution. If price corrects even mildly, this leverage stack becomes fuel for cascading liquidations, with the crypto market dropping over 2% on May 11 after Trump rejected Iran's peace response, post-reigniting macro risk-off across digital assets.
While derivatives traders piled into longs, long-term holders cooled off significantly with the hodler net position change tracking daily changes in XRP held by wallets with over 155 days of holding history. The metric peaked at 260.18 million XRP on April 12 and dropped to 152.6 million by May 10, representing a 41% decline in long-term holder buying. The reading has stayed depressed since early May, even as price moved higher, indicating that spot accumulation has slowed sharply. This matters because if long liquidations cascade, the slowing spot bid offers less of a cushion, with the hodler base having quietly stepped back, leaving the price more exposed to derivatives unwind.
The downside structure presents clear risk levels with Fibonacci levels running from the May 10 high of $1.50 to the recent low of $1.34. The 0.236 Fib sits at $1.46, the 0.382 at $1.44, and the 0.5 at $1.42, with XRP currently trying to stay above the $1.44 floor. The neckline of the bearish pattern sits at $1.34, with a break of this level confirming the double top and triggering an 11.09% decline to $1.19. The immediate resistance remains $1.50, the April 17 high, and $1.51, the May 10 high, with a clean 12-hour close above $1.51 potentially invalidating the double top and opening $1.54 as the next test. The cup-and-handle pattern that has been forming since March is now complete, with a measured target of $1.65-$1.70 if XRP closes above $1.50 on the weekly chart.