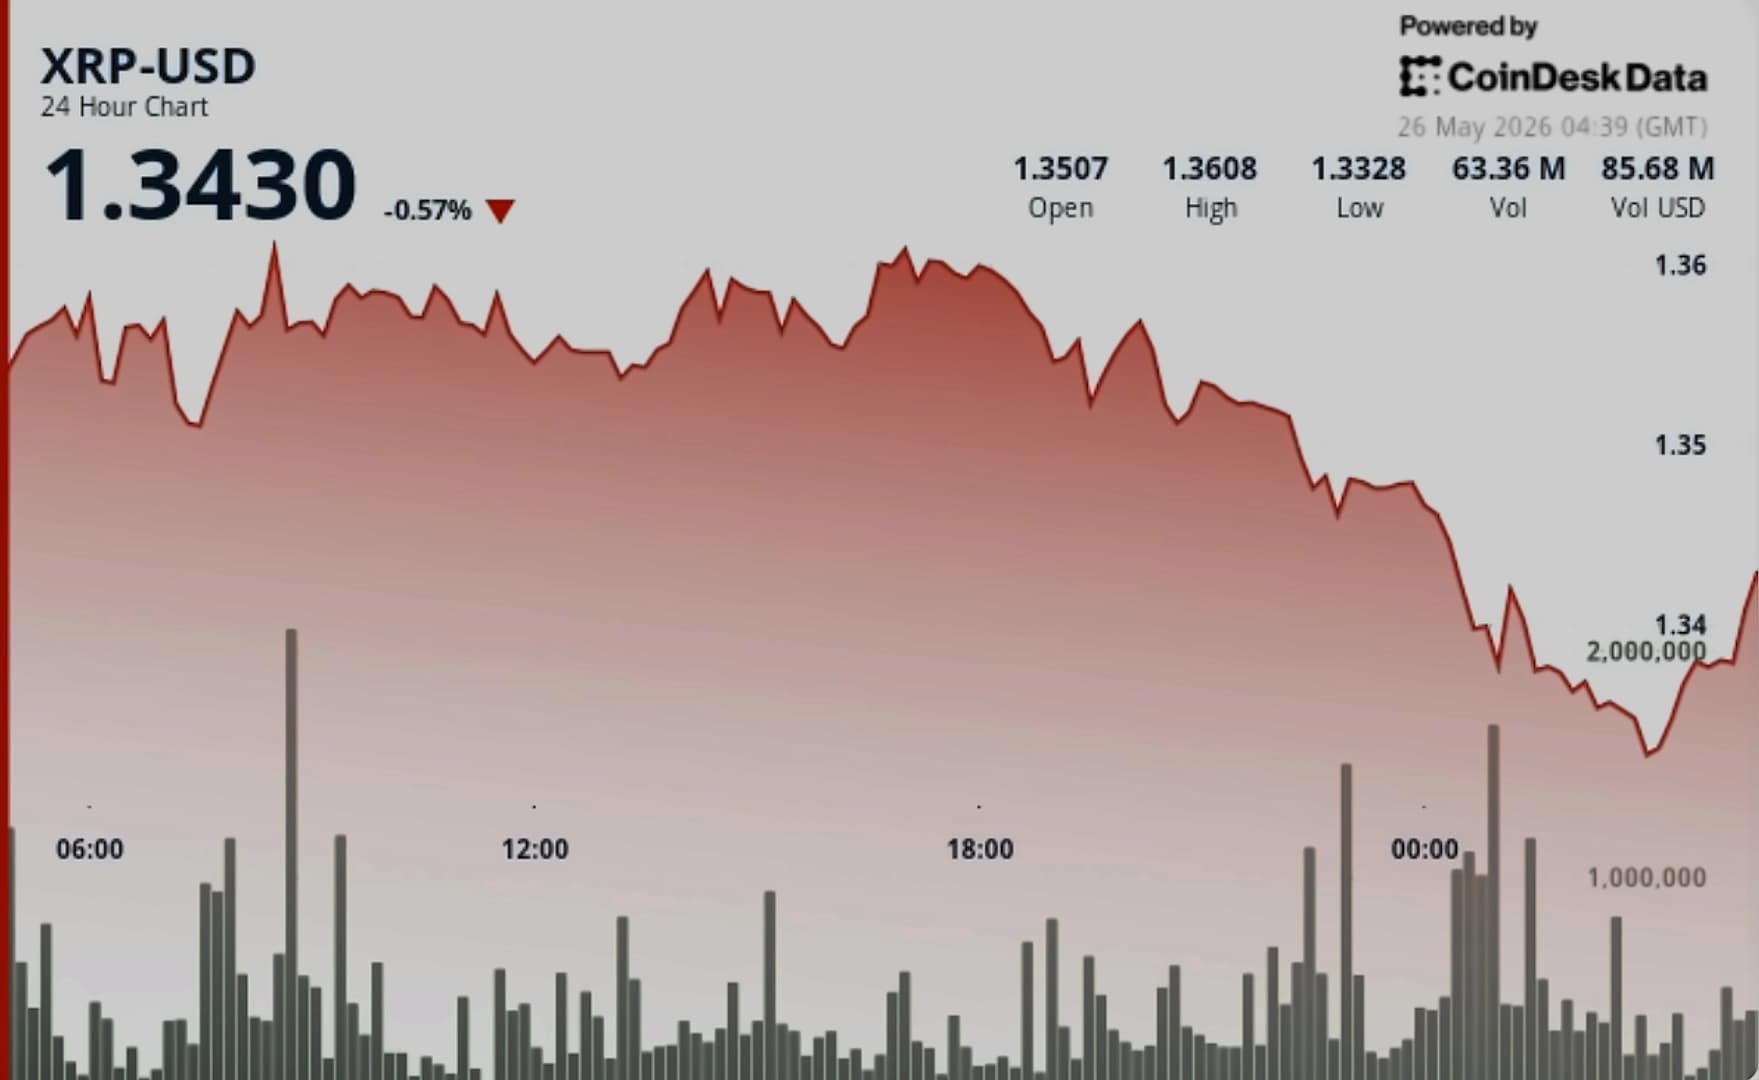
XRP faces significant downside pressure from a bearish head and shoulders pattern that could trigger an 18% decline below $1. According to technical analysis from crypto market observers, the pattern formed with the left shoulder in early March, head peak in mid-March, and right shoulder completing in mid-May. The neckline sits around $1.18, with XRP dropping to $1.30 on May 23 before recovering. A measured move from the neckline projects approximately 18% downside for XRP price, though on-chain and derivatives data suggest strong counter-pressure. The technical configuration remains active and dominant as long as price holds below the head-and-shoulders structure, with any reclaim above the right shoulder and head zone fully invalidating the pattern.
Despite the bearish technical setup, XRP has experienced a dramatic shift in exchange activity that could influence price action. As reported by Glassnode's Exchange Net Position Change metric, XRP outflows surged over 300% from -7,144,942 XRP on May 15 to -29,372,431 XRP by May 24. This represents a 300%+ increase in outflows over just nine days, indicating significant accumulation pressure. Net exchange outflows signal deliberate buying campaigns as coins moving out reduce available supply for immediate sale, potentially easing downside pressure. The trend has been steady rather than spiky, which is the configuration that signals deliberate institutional or whale-driven accumulation rather than retail FOMO, with holders positioning for an upside move rather than selling into strength.

The fundamental story underneath XRP that has not yet fully expressed itself in price is the spot XRP ETF flow profile. US spot XRP ETFs have crossed $1.41 billion in cumulative net inflows during May, making it the strongest month of the year per SoSoValue data. That magnitude of institutional capital deployment into a regulated wrapper structure is a structural bid that compounds quietly underneath the spot price even when daily candles look weak. The flow trajectory has been steady rather than spiky, which signals real allocator commitment rather than speculative chasing. The April flow comparison captures the magnitude of the May acceleration — April delivered roughly $55 million in net inflows over a single strong week, which was already one of the year's best weeks. May has now produced more than 25x that magnitude across the full month. The ETF demand is providing exactly the kind of structural support that prevents XRP-USD from breaking down through the $1.18 neckline on the head-and-shoulders pattern, even as the technical tape would otherwise be pulling price lower.
Derivatives data reinforces the range-bound thesis with significant changes in market positioning. According to Santiment data, XRP open interest dropped from $1 billion to $914.19 million since May 15, while total funding rates on long positions fell from 0.008% to 0.003%. The 62% drop in long funding rates reduces the risk of cascading long liquidations and lessens downside fuel for a breakdown. Combined with the buying pressure from exchange outflows, these derivatives trends weaken the breakdown thesis and suggest a potential tug of war between bullish and bearish forces. The derivatives positioning has compressed in a way that removes fuel from both the bullish and bearish scenarios simultaneously, with the total funding rate on long positions having compressed from 0.008% to 0.003% over the same window. The market is sitting in a derivatives equilibrium that favors a range-bound outcome over the next several sessions unless a fundamental catalyst forces directional positioning to rebuild.
XRP currently trades at $1.35 on May 25, maintaining the bearish setup while facing strong on-chain support. As reported by market observers, a move below $1.34 followed by $1.28 increases the drop risk significantly. The breakdown scenario would emerge below $1.21 and $1.18 levels, with a 12-hour close below $1.18 potentially pushing XRP to $1.01 and $0.96. The technical configuration that would invalidate the bearish thesis requires a clean 12-hour close above $1.55, with confirmation arriving on a sustained push through $1.60 that fully invalidates the head and shoulders pattern. Above $1.60, the 100-day EMA at $1.471 has already been cleared, and the 200-day EMA at $1.681 becomes the next structural target. The most likely outcome through the next two weeks is a continuation of the $1.30-$1.45 trading range with progressive tightening into the May 29 CME launch event, followed by a directional resolution that will define the XRP-USD path through the back half of 2026.