According to AMBCrypto, Solana (SOL) is currently trading at $77, up marginally from recent lows while showing signs of potential bullish momentum. The token has recovered about 5% from its July 18 low but remains below the $82–$84 zone reached earlier this month. Technical analysis shows Solana needs a daily close above $97.89 to confirm a breakout, with the token forming a base at $75 after sweeping liquidity below this level. The RSI indicator trades above the neutral level, indicating buying pressure is building, while the token has returned to consolidation between $75 and $97. The Aroon Up reading stands at 71.43% while Aroon Down has fallen to zero, indicating recent highs carry more weight than recent lows, though the Chaikin Money Flow remains slightly negative at -0.02.
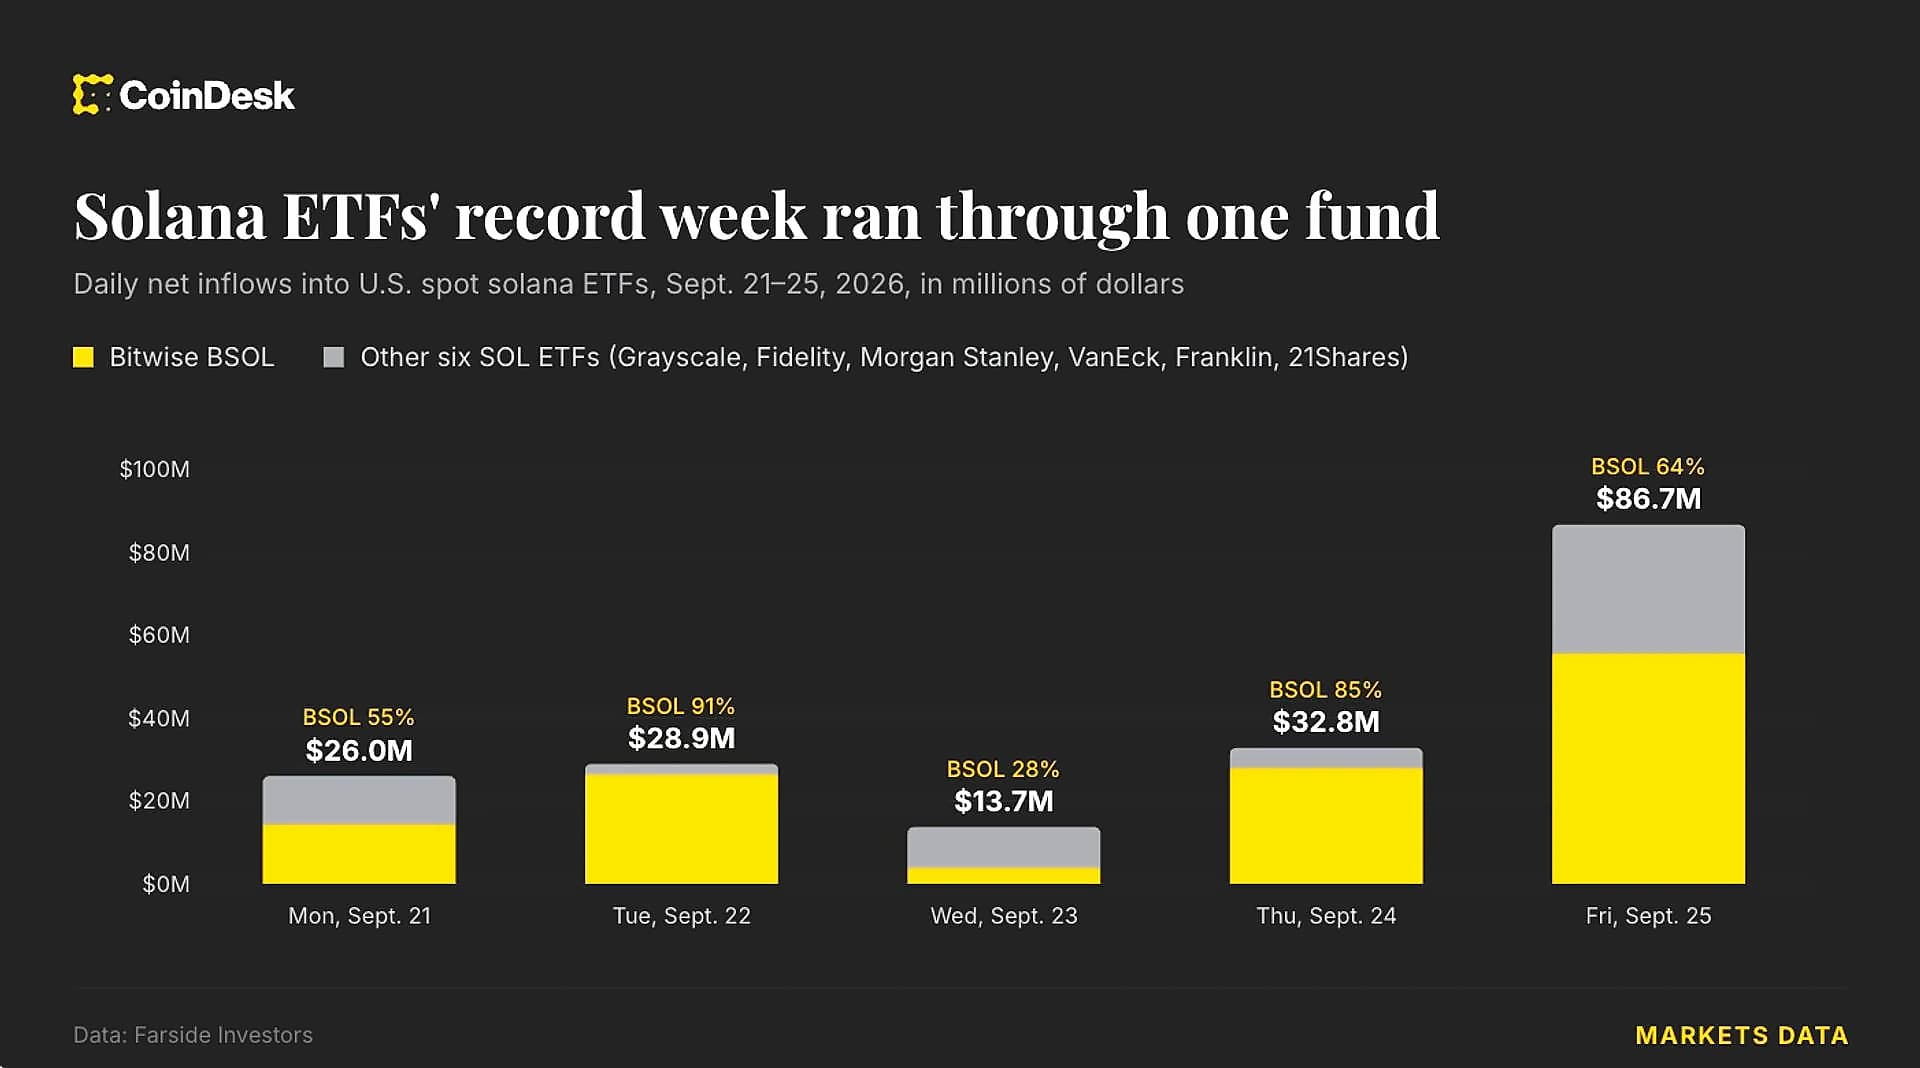
According to AMBCrypto, Solana ETFs recorded their highest daily inflows in two weeks, with the Bitwise Solana Staking ETF (BSOL) leading with $5.83 million worth of purchases on July 21. However, the positive momentum was short-lived as Solana ETFs recorded outflows of 16.4K SOL worth $1.27 million the following day, representing less than a quarter of the earlier inflows. The daily volume of Solana ETFs traded reached $54.47 million, with all assets under management nearing $1 billion. Notably, Solana and Hyperliquid ETFs account for nearly 80% of non-BTC/ETH ETF volume, demonstrating the network's growing institutional appeal. Additionally, dormant wallets returning to Solana DEXs surged to 62K last week, up from below 20K, representing a 400% increase from the previous week and the highest number of returning users in over a year.
Security concerns have weighed heavily on sentiment throughout July, with confidence across the Solana ecosystem taking a significant hit after an attacker drained nearly $20 million from BonkDAO. According to crypto.news, the attacker spent roughly $4.4 million to acquire enough BONK to meet the governance threshold, then passed a proposal with 99.9% approval. The incident did not compromise Solana's base layer, but it exposed weak safeguards within a major ecosystem project, with BonkDAO having low voter participation, no execution delay, and enough concentrated voting power for one participant to control the result. Another attack hit Allbridge Core on July 20, with the exploiter borrowing $1.12 million in USDC through Kamino and extracting more than $1.1 million before routing funds through privacy tools, with total liquidity loss estimated near $1.65 million.
According to Token Terminal data, Solana's total stablecoin market cap has crossed $15 billion for the first time, with USDC accounting for $7.09 billion and total Solana stablecoins reaching $15.16 billion. This growth has been driven by Circle's aggressive minting cadence, with the company minting $250 million worth of USDC on the network over the past 24 hours alone. The more structurally significant development lies outside the USDC/USDT duopoly, as the non-USDC/USDT stablecoin segment hit an all-time high of $4.81 billion, driven by USD1 and USDG. Anchorage Digital's USDGO reached a $1 billion market cap on Solana, up approximately 20x since January 2026, while USDT sits at $2.91 billion on the network. This diversification signals that dollar liquidity on Solana is no longer a two-party dependency, with the non-USDC/USDT segment now accounting for nearly one-third of Solana's total stablecoin market cap.
According to AMBCrypto analysis, Solana price must close above $97.89 to confirm a bullish breakout, with the token trading directly below resistance at $78.92, a level that previously acted as support in February, April and early June. A daily close above $97.89 would clear the first barrier, while $80 remains the psychological level required to confirm a breakout. Beyond $84, the July swing highs between $82.50 and $84 form the next supply zone, with a close above $84 potentially opening the route toward $90 and the previous range high near $97.60. However, the Chaikin Money Flow remains slightly negative at -0.02, which shows that capital inflows have not yet matched the price recovery. The Moving Average cross occurred with the fast-moving MA rising above the slower MA, indicating potential bullish momentum toward the $120-$130 zone, though these targets depend on a sustained breakout in the coming weeks. The one-week liquidation heatmap shows concentrated leverage above the market at $77.50–$78.20, with another dense band near $78.80, while a sustained close below the $75.55 4-hour 200-period moving average would return SOL beneath its moving-average cluster.
Geopolitical pressure remains a significant hurdle for high-beta cryptocurrencies, with Brent crude settling at $91.01 on July 21 after U.S.-Iran hostilities, and Houthi threats against Red Sea shipping routes raising concerns over energy supplies. The dollar index advanced to 101.16 as traders increased bets that higher oil costs could keep the Federal Reserve focused on inflation. A stronger dollar and renewed rate-hike expectations usually reduce demand for speculative assets, making Solana dependent on both crypto-market strength and reduced pressure from energy prices to sustain a move beyond nearby resistance. As reported by crypto trader Daan Crypto Trades, SOL has reached a "key high timeframe region" that will decide whether bulls can attack the upper end of the range, with the potential for either a higher low to take a stab at the range high in the $90s or a rejection that could pull SOL back to the mid $60s area.