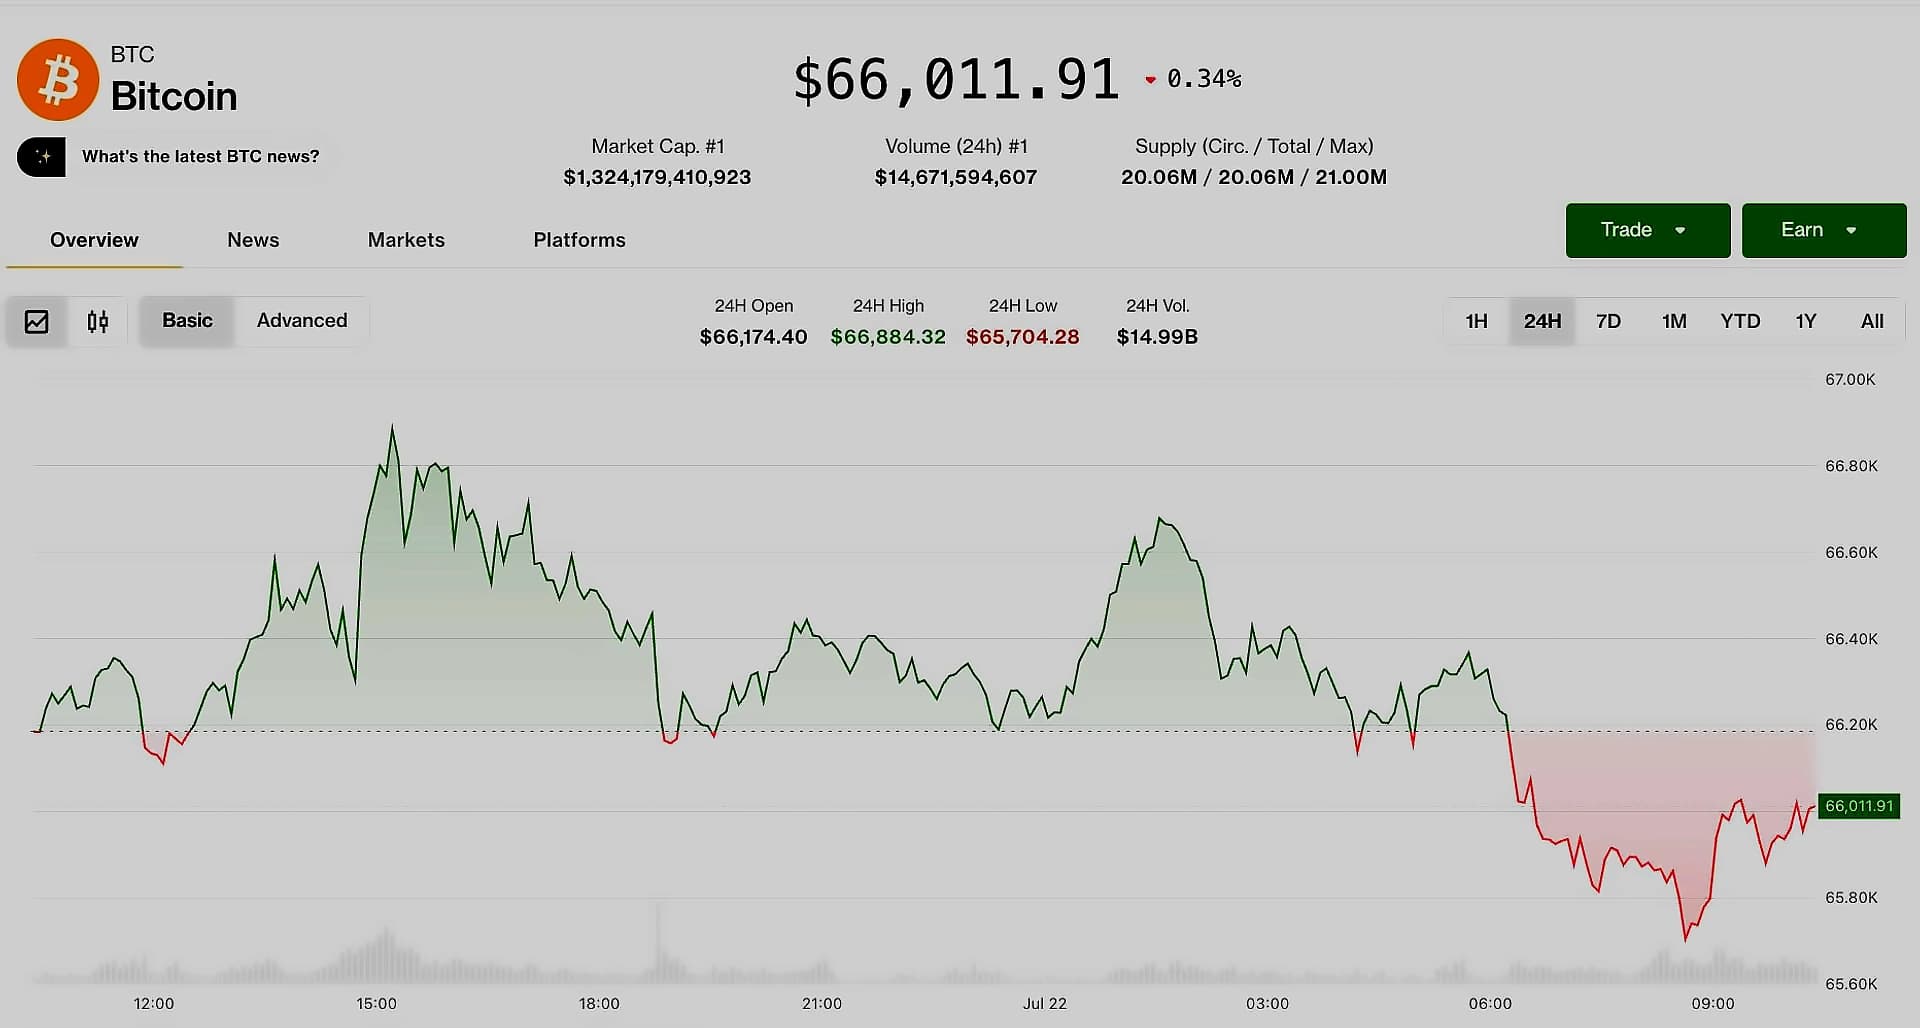
Bitcoin traded near $63,500 during Asian hours on Monday, August 17, recovering 0.77% since midnight UTC but remaining 2.3% lower over seven days as the cryptocurrency market entered another week with limited momentum. The cryptocurrency remains below last week's highs after falling as low as roughly $62,500 on Friday before stabilizing through the weekend. Bitcoin's market capitalization stood near $1.27 trillion with Bitcoin dominance remaining close to 57%. Among major altcoins, Hyperliquid's HYPE rose 3.53% to $59.08, continuing its steady grind and now up around 2% on the week, while Zcash gained 4.70% at $508, extending a notable stretch for privacy coins following XMR's strong run last week. As per crypto.news, most large-cap cryptocurrencies posted modest daily gains, but weekly performance remained mixed after Bitcoin fell from above $65,000 during the previous week.
Bitcoin ETFs recorded $390 million in net outflows during the week ending August 14, marking a sharp reversal from the previous week's $853.5 million inflows and representing the heaviest weekly outflow since early July. According to crypto.news, the selling traces directly to Brent crude pushing above $88 per barrel, up more than 5% after the US announced its naval blockade of Iran could run indefinitely while talks to reopen the Strait of Hormuz remained deadlocked. The same blockage affects close to a quarter of the world's urea shipments through Hormuz, with JPMorgan noting that nitrogen fertilizer benchmarks jumped 25-50% after the conflict began. With the World Bank's fertilizer index near its highest since 2022, global food inflation is approaching 4-5%, creating macro pressure that drains liquidity from risk assets like Bitcoin. Solana ETFs bucked the trend with their strongest weekly inflows since May, providing some relief to the broader altcoin sector.
Jane Street's disclosure of a $990 million bitcoin ETF stake has traders questioning whether the near-billion-dollar BTC exposure is as bullish as it appears, coming on the heels of a reported $15 billion loss elsewhere in its book. The broader market context shows spot ETFs logged back-to-back outflows for the first time since late July, with BTC sliding from roughly $65,000 into the $63,000–$63,500 zone over the past week, representing a 3% weekly drawdown. Bitcoin feels trapped near $63,500 and capped below $64,000 through Monday's session, with CoinGecko data flagging $62,600–$62,700 as the zone where dip-buyers keep stepping in, while $63,800 acts as near-term resistance on the way back up. Volume hasn't confirmed a breakout in either direction, with miner selling and long liquidations adding friction on dips, while ETF outflows cap enthusiasm on bounces.
A 30-year Treasury yield hitting its highest level since 2007 is creating additional pressure on risk assets, with rising yields squeezing liquidity across both stocks and crypto markets. The tightening liquidity backdrop doesn't discriminate between asset classes, creating a challenging environment for Bitcoin and other cryptocurrencies. The bull case scenario involves a reclaim above $64,500 with volume follow-through, opening the door to a retest of $65,000, while the base case expects continued chop between $62,800 and $64,000 as markets digest institutional positions and await macro clarity. The bear case involves a break below $62,000 with rising Treasury yields accelerating outflows, dragging BTC toward the low-$60,000s. Bitcoin's notional open interest, at $48 billion, is now nearly double its 24-hour trading volume, raising swing risk as any mass liquidation event could run into thin liquidity.
According to crypto.news, Bitcoin's daily chart shows BTC consolidating after its sharp June pullback, with price hovering near $63,500 and posting a modest 0.94% intraday gain. Despite the short-term uptick, BTC continues to trade below the key resistance band around $65,000–$66,000, keeping the broader structure tilted to the downside compared with earlier cycle highs. The Aroon Oscillator sits in positive territory at 42.86, suggesting that recent upward moves are currently outweighing recent lows, pointing to mild bullish momentum in the short term. However, the MACD continues to reflect bearish conditions, with the histogram at approximately -124.49 and the MACD line near -236.26, still positioned below the signal line around -111.77, indicating that downside momentum has not fully dissipated despite the recent price recovery. Bitcoin and ether's 30-day implied volatility indexes remain pinned near year-to-date lows, suggesting fear levels and demand for options-based insurance against price swings are both muted, while CoinMarketCap's Fear and Greed index sits at 38/100, a "fear" reading, and the Altcoin Season Index is at 46, showing altcoin strength recovering from the Aug. 7 low of 36.