Bitcoin has fallen 1.22% to $79,669 despite maintaining its position above the critical $80,000 support level, as reported by latest market data. Ethereum has declined 0.40% to $2,263.44, while Binance Coin stands out with a 2.64% increase to $671.45. Other major cryptocurrencies like Solana and TON are experiencing notable declines, reflecting ongoing market volatility and investor caution. The mixed performance comes despite Bitcoin's bull-bear cycle indicator on CryptoQuant turning green for the first time since March 2023, marking a significant shift in market sentiment after nearly two years of bearish conditions. Social media activity surrounding Bitcoin and blockchain analytics has surged following the market update, as industry commentators, institutional analysts, and retail investors alike debate whether this latest signal could mark the beginning of a new chapter in Bitcoin's market evolution.
Bitcoin remains above $80,000 despite inflation-driven macro pressures linked partly to Iran tensions, demonstrating resilience in the current market environment. According to latest market analysis, analyst Matt Mena suggests a drop below $80,000 could push bitcoin toward $78,000 and possibly $75,000 if selling increases, though the recent inflation shock might be the last wave of weak sellers before bullish factors take hold. The cryptocurrency has shown mixed performance following Donald Trump's 2024 presidential win, rising 18.73% from election day to May 2026 but falling 21.08% since his inauguration. A move toward $100,000 by quarter-end is also considered possible if bitcoin reclaims $82,000 resistance, as reported by market analysts. Bitcoin's continued resilience following previous market downturns has also strengthened long-term investor confidence, with the cryptocurrency repeatedly recovering and reaching new highs over time despite multiple bear markets throughout its history.
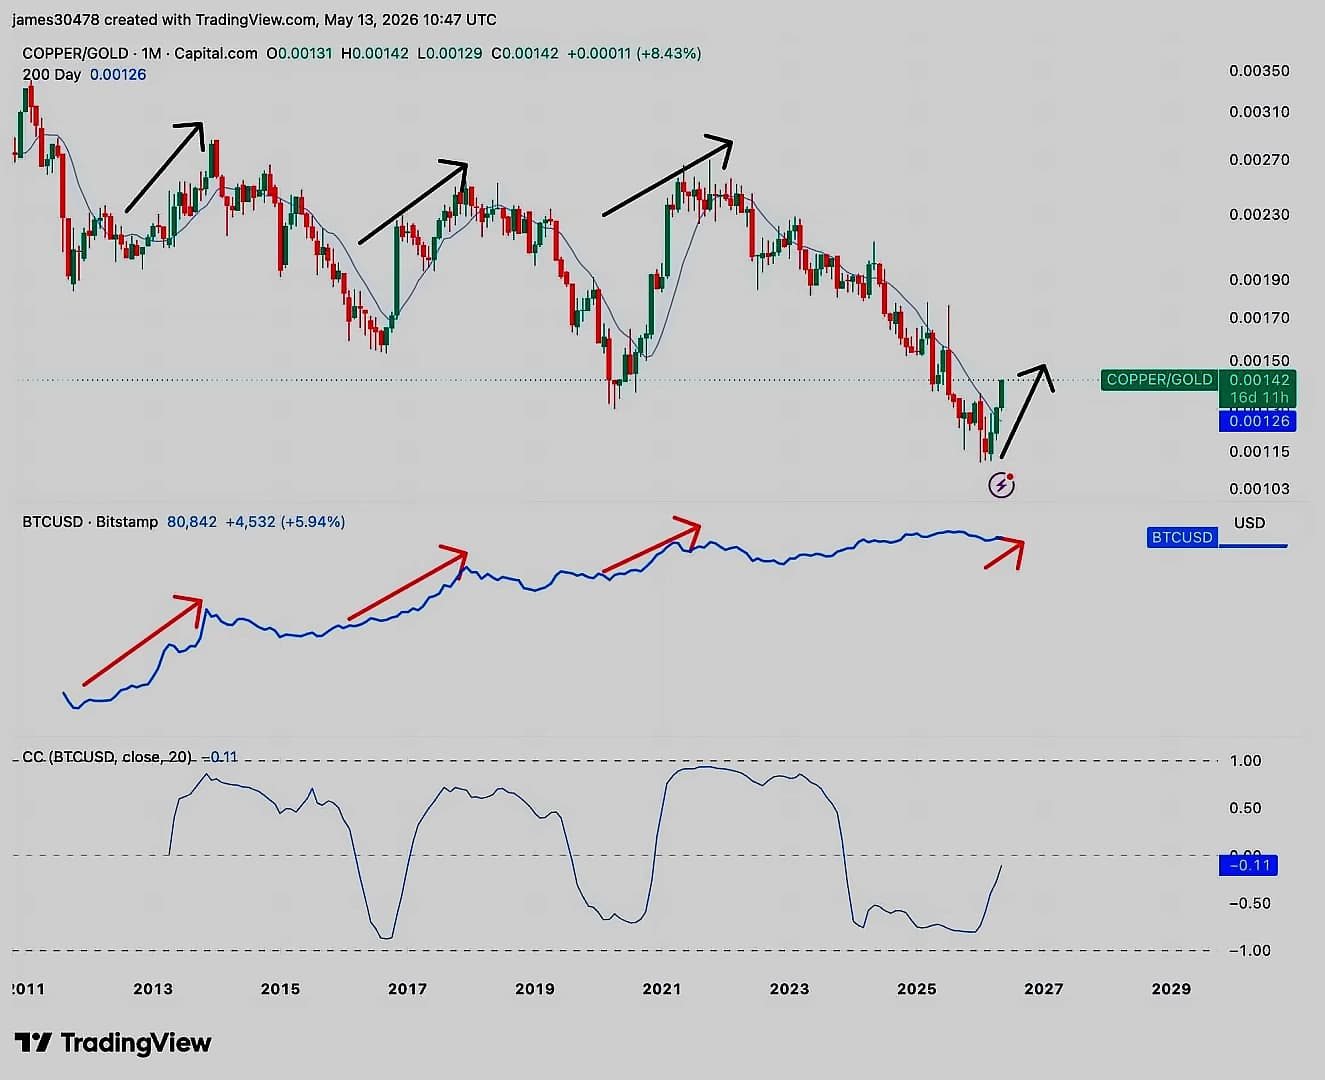
The copper-to-gold ratio has broken above its 200-day moving average for the first meaningful time since September 2020, according to recent market analysis. This development has historically coincided with the early stages of bitcoin rallies, with the ratio currently standing at 0.00142 as copper trades at $6.65 per pound and gold near $4,700 per ounce. Previous surges in the ratio during 2013, 2017, and 2021 aligned with major gains in bitcoin prices, suggesting the current move may still be in its early stages. The breakthrough represents the first meaningful breakout in nearly six years, marking a significant shift in market dynamics and investor sentiment. Michael van de Poppe, a prominent crypto analyst, has highlighted this metric as a key indicator of growing strength and investor appetite in crypto and altcoin markets, noting that while not directly related to cryptocurrencies, the ratio reveals strong investor appetite in broader markets.
In Q1 2025, Jane Street, a major quantitative trading firm, cut its Bitcoin ETF holdings while increasing exposure to Ethereum ETFs and Galaxy Digital, a crypto financial services company, according to recent market reports. This shift suggests a portfolio rebalancing strategy rather than a complete exit from Bitcoin, as institutional investors continue to maintain positions while adjusting allocations. Growing interest from traditional financial institutions has strengthened perceptions that Bitcoin is gradually becoming integrated into mainstream finance, with large asset managers and banking institutions significantly increasing involvement in digital asset services over recent years. The cryptocurrency market has evolved substantially since previous bull run periods, with institutional investment products, regulated Bitcoin exchange-traded funds, and expanding blockchain-based financial services contributing to growing legitimacy for the asset class.
The copper-to-gold ratio is widely viewed as a gauge of economic momentum and investor risk appetite, with copper closely tied to industrial demand and gold traditionally associated with defensive positioning. A rising ratio therefore signals a more risk-on macro environment, with the current breakout above the 200-day moving average reinforcing this bullish sentiment across commodity markets. Bitcoin's supply structure has long been considered one of its defining economic features, with the cryptocurrency having a fixed maximum supply of 21 million coins, creating scarcity dynamics that supporters argue contribute to long-term value appreciation. Market observers additionally note that Bitcoin's periodic halving events historically influence broader market cycles, with halvings reducing the rate of new Bitcoin entering circulation and often contributing to tighter supply conditions over time. Several analysts believe that if institutional demand continues rising while available supply remains constrained, Bitcoin could experience substantial upward momentum during the next market phase.
The copper-to-gold ratio has risen 25% from its lows and historically leads bitcoin by weeks to months, as reported by market analysts. This pattern suggests that while the current crypto rally may still be in its early stages, the underlying economic momentum indicators are strengthening. The ratio's breakout above its 200-day moving average represents a significant technical development that has preceded major bitcoin rallies in previous market cycles, supporting the view that the current move may still have room for further expansion. The current breakthrough marks the first meaningful breakout since September 2020, making it particularly significant for market participants tracking this historical correlation pattern. Van de Poppe's recent comments add to his ongoing coverage of sector-specific investment trends, providing additional validation for the significance of this ratio breakout in the current market environment.