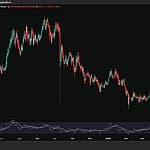
Bitcoin has been stalled between $77,899 and $80,339 for weeks, creating what analysts are calling a potential catalyst for altcoin season. According to reports from 99Bitcoins, this consolidation pattern historically precedes altcoin market movements, as institutional capital begins rotating down the risk curve from Bitcoin into other cryptocurrencies. The mechanism involves crypto capital rotation, where the total crypto market represents a single pool of money that shifts focus when Bitcoin surges or stalls. Latest data shows Bitcoin has held above $80,000 for a week, preserving a bullish higher-low structure across multiple timeframes, with price action now trapped between key resistance near $82,800 and critical support between $79,500 and $80,000. The current rally has seen Bitcoin climb 17.79% over the past month, reaching a current price near $81,000, though this strong rebound is being driven by potentially fragile speculative flows.
Despite the current rally, on-chain data reveals significant profit-taking pressure that could derail the upward momentum. The 24-hour average of Short-Term Holder Realized Profit has surged to $4.4 million per hour, nearly triple the $1.5 million threshold that has marked every local top this year. This surge indicates that a large cohort of recent buyers who accumulated between $60,000 and $70,000 are now approaching significant profits and have strong incentive to exit. Glassnode data shows that a recovery toward the Short-Term Holder Cost Basis near $80,500 would push more than 54% of recent buyers back into profit, creating a large, incentivized pool of sellers poised to exit. The hourly realized profit rate has already surged to $4.4 million per hour, nearly triple the threshold that has marked every local top this year, representing the core distribution pressure that any rally must overcome.
Large holders are exhibiting conflicting behavior that reveals internal market tension. As reported by Crypto.news, whales aggressively bought during last week's Iran-related sell-off but then sold roughly 66% of those positions as prices rebounded to $74,000. This pattern of buying panic and selling rallies suggests they are betting on a deeper test of support, not a breakout. The behavior of large holders is the clearest signal of the market's internal conflict, with about 43% of bitcoin's total supply now at a loss, creating persistent selling pressure. Retail investors are moving in the opposite direction, steadily increasing their positions as prices slipped back below $70,000, creating a classic dynamic where retail buys while whales sell, often signaling that a market correction is not yet finished.
The market stress extends beyond short-term holders to long-term investors who are experiencing unprecedented losses. Over $304 billion worth of Bitcoin is held by long-term investors who are underwater, representing the largest share of losses since 2023. This is not just a paper loss; it is a tangible source of selling pressure. The situation is worsening as the share of long-term holders sitting in profit has been quietly shrinking, indicating a sharp deterioration in confidence among the market's most committed participants. This divergence between price action showing a rebound and on-chain metrics revealing deep stress among the largest holders creates a classic warning sign that mirrors periods before steep drops in 2018 and 2022. The current calm where holders are not yet rushing to sell may be temporary, with the hidden pressure potentially turning into a wave of selling if the rally stalls.
Technical analysis reveals mixed signals as Bitcoin enters a compression phase, with the rally's sustainability now hinging on critical flow metrics. The price has broken above the True Market Mean, a key cyclical level, but the next major target is the Short-Term Holder Cost Basis near $80,500. A move toward that level would push more than 54% of recent buyers back into profit, amplifying distribution pressure. The rally's next move hinges on spot volume confirmation, as for the price to hold above $81,000, we need to see a clear break above that level on spot trading volume. Without spot volume confirmation, the move remains reliant on perpetuals, which can amplify volatility. The current setup, where spot demand is contracting, makes this volume confirmation critical for validating the breakout. Technically, the path is defined by two key zones: the medium-term target is the $76,000 resistance level, which could be reached within the next month if momentum builds, while critical support sits at $70,633.