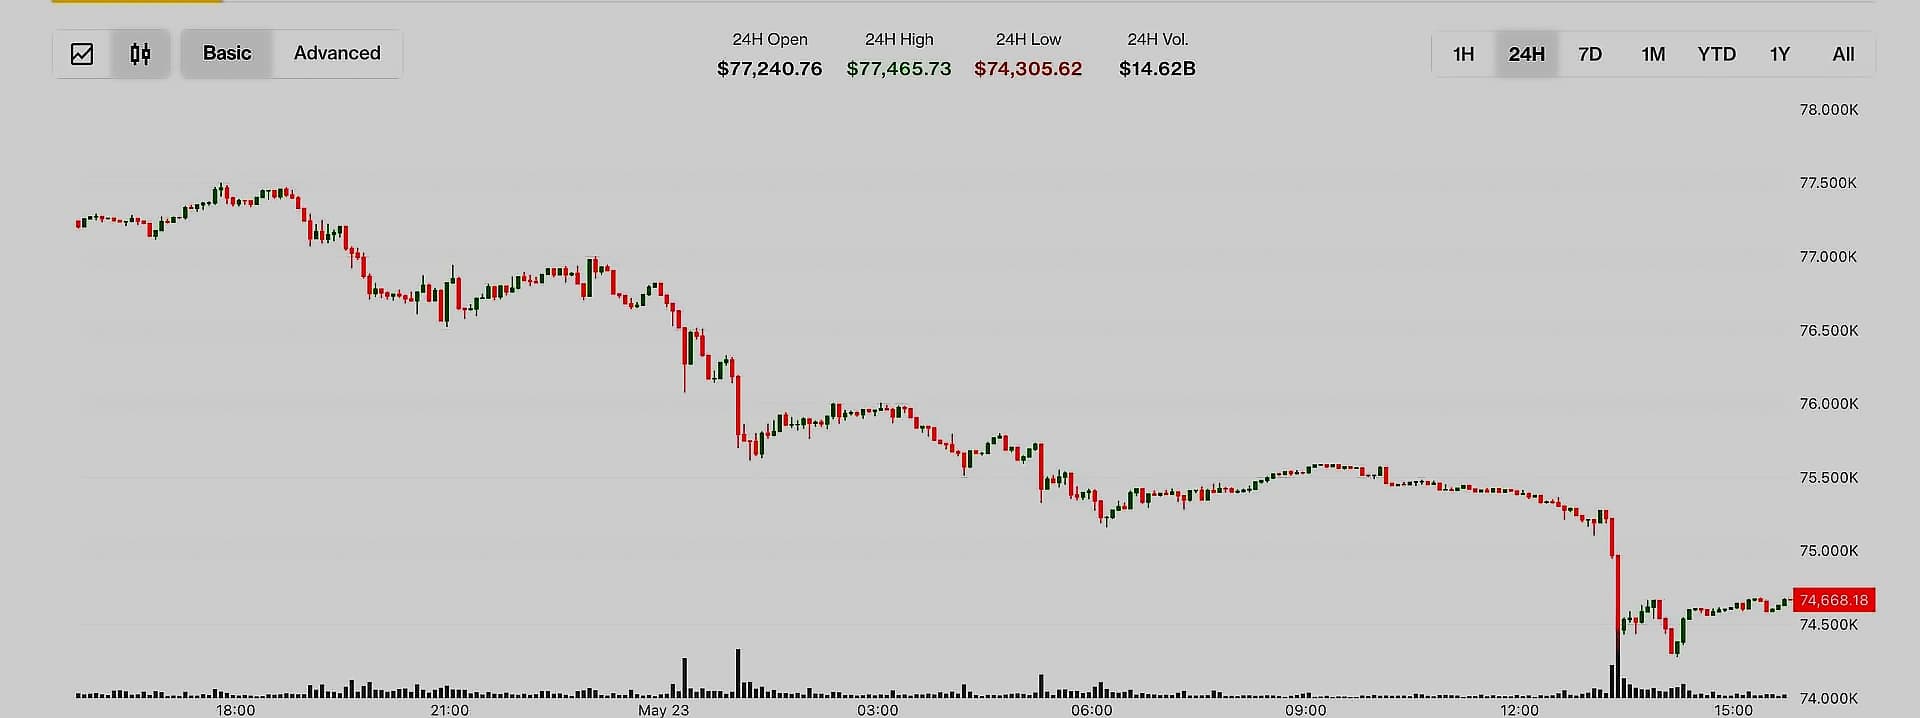
Bitcoin has declined to $76,905 at press time, breaking below the critical $78,000 support level that was widely anticipated as the key threshold for maintaining Bitcoin's bullish outlook. According to on-chain analysis from AMBCrypto, this breakdown represents a significant technical failure that opens the door to further capitulation. The asset has established lower highs and lower lows in the short term, with potential downside targets reaching the lower end of the $70,000 region, a level last visited during market recalibration. However, recent data suggests the decline was not driven by long-term holders rushing for exits, with the price sitting near $78,200 during recent periods, well off last October's reported high near $126,000. Technical analysis from TradingView indicates Bitcoin is experiencing a fresh bearish leg emerging with complex correction patterns, while the market structure shows lower highs and lower lows indicating supply dominance.

Bitcoin exchange reserves have experienced a significant increase, adding 20,000 BTC since April 25th, rising from 2.66 million to 2.68 million BTC at press time. This translates to approximately $1.53 billion in Bitcoin flowing into crypto exchanges within this period, as reported by AMBCrypto. Market netflow analysis shows investors have already begun offloading, with 1,113 Bitcoin worth roughly $87 million sold into the market over the past three days, indicating the exit strategy is already underway for some holders. However, exchange netflow has been oscillating closer to zero, with brief spikes into positive territory suggesting short-term repositioning rather than sustained distribution. TradingView analysis suggests the current decline represents a sharp sell-off → likely liquidity grab + exhaustion phase, with the market showing small base forming at support that suggests potential short-term reversal.
The Bitcoin ETF market experienced significant outflows during the same period, with the seven-day average of U.S. spot BTC ETF net flows dropping to negative $88 million per day, marking its worst reading since mid-February. According to Glassnode data, Bitcoin ETF outflows hit a months-high that same week, with U.S. spot BTC ETFs seeing roughly 13,000 BTC leave the products in a single week. Ark-related funds alone accounted for more than 4,000 BTC of that figure, as reported by CryptoQuant analysis. The Coinbase Premium Index stayed negative throughout the period, indicating that U.S. spot demand had not returned, while the macro backdrop included rising Treasury yields and dollar strength that quickly bled into risk assets. TradingView analysis notes that macroeconomic pressures, regulatory uncertainty, and technical exhaustion are contributing to the current bearish environment, with the market experiencing risk-off mood as traders move to the sidelines ahead of key events.
Despite the price decline, recent market data reveals a significant shift in long-term holder behavior that could signal a potential market reversal. Coinpowerofficial reports that supply held by long-term holders is exploding higher, with these investors now accumulating again after previous selling pressure. This historical pattern typically occurs when strong hands absorb coins before major expansion phases, suggesting that smart money isn't selling at current levels. The analysis suggests the question becomes who will buy when supply gets even tighter, as this accumulation behavior by long-term holders often precedes significant market movements. Short-term holder behavior has emerged as a central factor in Bitcoin's recent decline, with these investors now selling below their realized price of $78,000, but the current accumulation by long-term holders could provide support for a potential reversal.
The combination of technical breakdown and increased exchange reserves creates a challenging environment for Bitcoin's near-term performance, though recent long-term holder accumulation signals potential for a reversal. As reported by AMBCrypto, the rising Bitcoin reserves signal that more of the asset is sitting on exchanges and available for immediate sale, adding fresh layers of threat to the asset's performance. The analysis identifies the realized cap impulse climbing back above the 0% mark as a key condition for genuinely bullish Bitcoin environment, a level the asset has so far failed to reclaim. TradingView analysis suggests the current structure shows bearish rejection? with the 78,700 area → Strong supply zone acting as a significant resistance level, while the 79,240 level remains a key inflection point where the bias favors further downside as long as price remains below this level. However, the recent long-term holder accumulation and stabilizing netflow volatility suggest a re-accumulation phase may be forming rather than a structural collapse, with supply leaving exchanges and not coming back, while the price chart shows minor support / recent reaction lows that could provide temporary relief before the next major move.