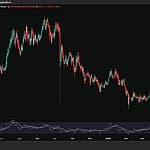
Bitcoin's dominance remains 58.1% in May 2026 with a total crypto market cap of $2.66 trillion, though this figure is artificially suppressed by stablecoins worth over $300 billion. According to latest data, stablecoins at $300B+ artificially suppress BTC.D by 6-8 percentage points, meaning Bitcoin actually controls nearly two-thirds of all active risk capital in crypto. BTC.D hasn't dropped below 50% since September 2023 - the longest sustained run above 50% since early 2017, driven by $56.9 billion in ETF inflows since January 2024. The ETF era has created a structural floor that didn't exist before, with institutional money overwhelmingly favoring Bitcoin over altcoins. ETF inflows often precede BTC.D movements by days, as the first trading day of 2026 alone saw $471.3 million flow into Bitcoin ETFs, with $56.9 billion worth of ETF inflows since January 2024.
Bitcoin's price has remained pinned between $78,000 and $82,000 despite record institutional buying, with ETF products absorbing $630 million in a single session on May 1 alone. The first two trading sessions of May combined for $1.1 billion in total inflows, while post-halving miners now produce approximately 13,500 BTC each month. However, institutions are absorbing close to 50,000 BTC per month, creating a supply squeeze that should point strongly upward. According to Alphractal's analysis, over 14 of the last 21 trading sessions saw retail investors show net buying activity, while whale-side readings showed net selling during the same periods. The divergence between demand and price movement has puzzled many market participants, with the Market Capitulation Oscillator remaining in negative territory throughout this period. A falling BTC.D doesn't automatically mean altseason - traders must confirm that total market cap is also growing, as fresh money entering the market flows beyond Bitcoin during bullish phases.
According to BeInCrypto analysis, institutional and whale activity is driving momentum in three altcoins this weekend. Santiment data revealed significant whale accumulation in ONDO, with the 1 million to 10 million token cohort increasing their holdings from 555.38 million to 594.05 million tokens earlier this month. This accumulation represents approximately 38.67 million ONDO tokens over the period, demonstrating sustained institutional interest. Similarly, a16z-linked wallets have been actively accumulating HYPE, purchasing 2.34 million tokens worth $102 million since April 14, while Bitwise and 21Shares spot HYPE ETFs recorded record $25.5 million in net inflows on May 21. The latest data shows the same a16z-linked wallet bought another 261,250 HYPE in the past 10 hours, indicating continued institutional accumulation during post-ATH consolidation.
Analysts tracking long-term holder cohorts have identified a critical pattern where 47 wallets holding coins for more than five years have moved since the halving, with the combined volume reaching 38,400 BTC in 2026. According to Whale Alert data, 72% of moves from wallets dormant more than seven years in 2026 resolved as OTC transactions rather than exchange sells. On May 11, a dormant wallet from 2013 moved 500 BTC, highlighting the ongoing distribution from early Bitcoin holders. These coins are being routed off-screen through OTC desks and absorbed quietly, with ETF buyers providing exit liquidity for early Bitcoin holders. The price stays flat because supply and demand are nearly balanced through this mechanism, though once old-whale distribution exhausts itself, institutional buying gains no counterweight, pointing sharply upward.
ONDO currently trades at $0.41 on May 22 after declining 1.73%, though it holds a dominant 60% share of the tokenized stocks market. As reported by BeInCrypto, the token has shown strong technical indicators with whales increasing their positions from 7.90 billion to 7.93 billion tokens in hours before the weekend. The chart analysis reveals ONDO trading inside a falling channel since the May 9 local high at $0.48, with price grinding against the upper trendline and rising volume since May 14. A clean break above $0.42 opens path to $0.45 and $0.48, while the 200-day EMA at $0.40 serves as immediate support. ONDO trades above all four exponential moving averages (EMA), a trend-following indicator, with the $0.43 level marking the 0.618 Fibonacci level - a strong technical reference drawn from prior swings. The bullish thesis fails if ONDO loses $0.40, exposing $0.36 and $0.33 below.
HYPE trades at $57.68 on May 22 after touching a new all-time high near $62.73, with BeInCrypto identifying the token as one of the most interesting altcoins to watch. The analysis shows HYPE inside a bull flag after consolidating from $62.73, with the flag pole measuring a 63.62% move from the April $38.21 swing low. Chaikin Money Flow (CMF) sits at 0.06, trending higher with price since April 15, indicating institutional accumulation during post-ATH consolidation. A CMF move above 0.08 confirms the institutional bid and supports the flag breakout, with HYPE needing to stay above $56.93 to keep the flag valid. A clean break above $58.58 then $62.73 opens the 1.618 extension target at $95.71, while HYPE needs to maintain levels above $53.35 to preserve the flag structure. The rally has been supported by spot ETF inflows, perpetual markets, and surging perps volume, all stacking behind the move.