National Stock Exchange of India Limited commands approximately 90% market share across most trading segments and captures roughly 70% of total Indian exchange revenues. This dominance creates a self-reinforcing competitive moat that BSE Ltd and Multi Commodity Exchange of India Ltd cannot easily replicate. NSE's multi-asset product mix—spanning equity cash, index options, single stock options, equity futures, commodity F&O, bonds, and currency derivatives—provides revenue stability that competitors lack. While BSE has made strides in derivatives and MCX dominates commodities, both remain concentrated in specific segments. NSE's diversification across asset classes creates cross-selling opportunities and reduces dependence on any single market cycle.
The revenue concentration becomes stark when examining derivatives. Equity options grew at 56% compounded annually between FY20-26, with NSE's premium turnover reaching ₹190.65 trillion in FY26. This explosive growth means derivatives now account for 70% of operating revenues across Indian exchanges. NSE captures the majority of this through its 74.71% market share in equity options by premium turnover. BSE's recent market share gains through aggressive pricing—zero fees on futures versus NSE's 0.00183%—demonstrate that dominance is not invincible, but these gains may not be sustainable long-term. DRHP +1
Clearing Corporation Competitive Advantage
NSE's clearing subsidiary, NSE Clearing Limited (NCL), provides a critical structural advantage. NCL clears approximately 95% of equity cash and derivatives trades in India under the CCP interoperability framework. This clearing dominance—88% market share in cash markets and 91% in F&O—creates several profitability-enhancing mechanisms that BSE cannot match. The vertical integration allows NSE to capture value at multiple points: trading fees, clearing fees, and settlement services.
The clearing advantage translates directly to profitability. NSE's normalized operating EBITDA margin of 76.23% significantly exceeds BSE's 67% operating EBITDA margin. This margin superiority stems from NCL's scale economies, which enable superior risk diversification and more efficient capital deployment. With AAA credit rating since 2008, NCL operates with lower capital requirements and funding costs compared to smaller clearing corporations. The integrated model also creates switching costs—once participants integrate with NSE's technology stack and clearing systems, the complexity of moving to competitors creates significant barriers. DRHP +1
Technology and Data Moat
NSE's technology and data offerings represent a strategic differentiator accounting for approximately 13% of FY26 revenues. This includes data connectivity charges (₹11,287.91 million), data feed and terminal services (₹4,700.74 million), and data centre rack charges (₹2,051.75 million). NSE's technology infrastructure processes ~5 million messages per second with microsecond response times, supporting 200,000+ trading terminals across 1,400+ cities. This scale creates unit cost advantages that smaller exchanges cannot match. DRHP +1
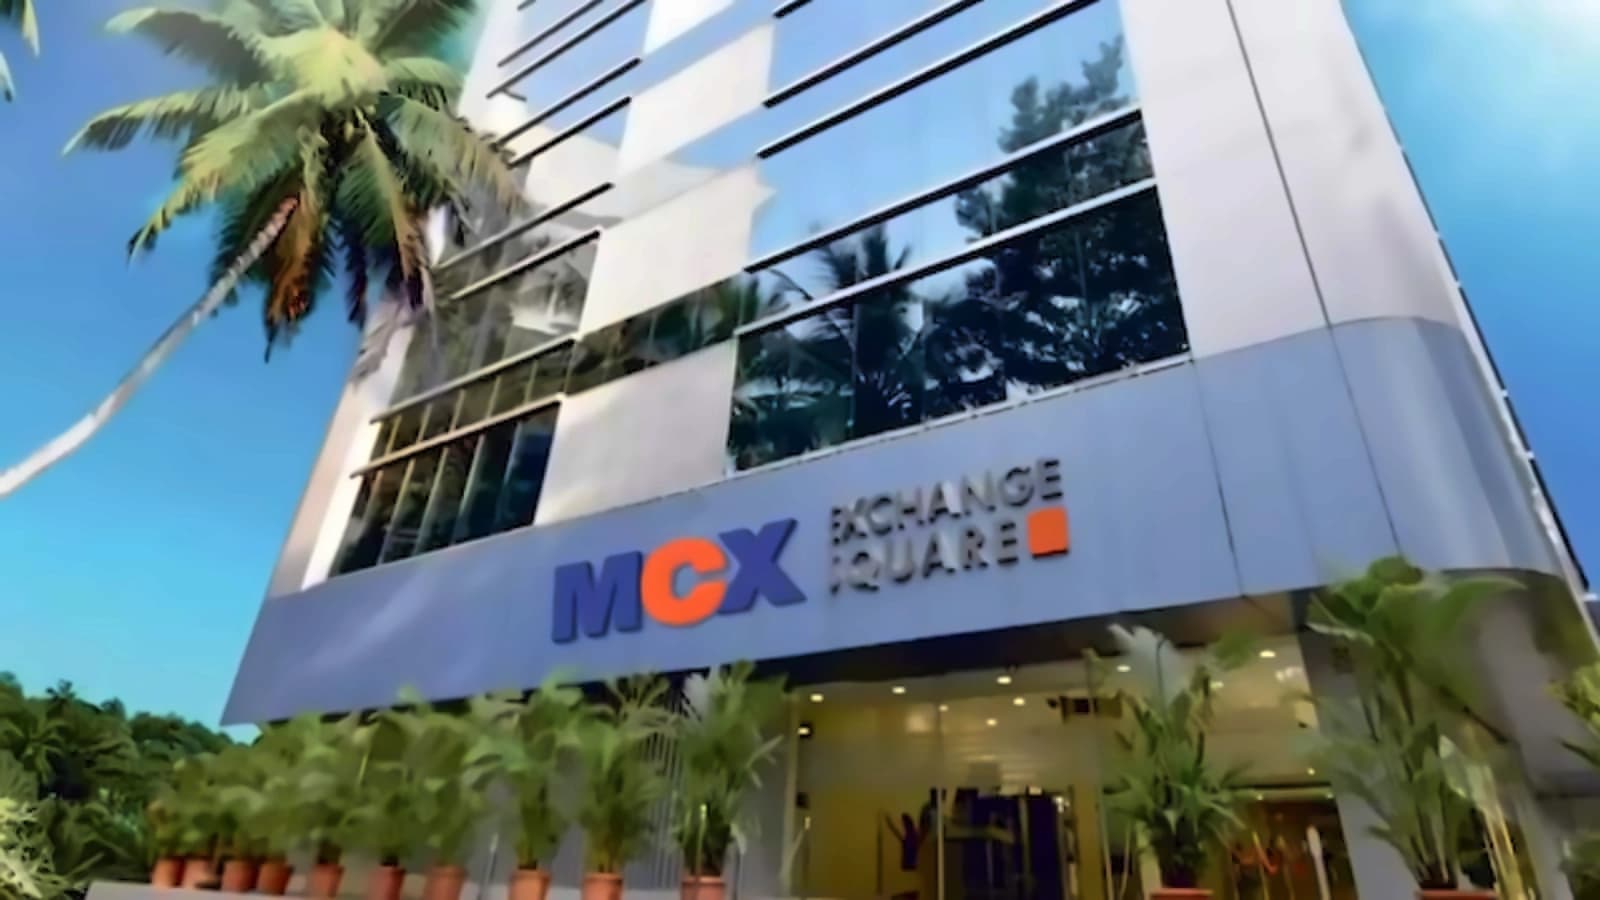
The technology moat extends to NSE's commodities expansion. Since entering commodity derivatives in October 2018, NSE has grown average daily trading value to ₹910.68 million in FY26 from ₹188.86 million in FY25. This expansion directly challenges MCX's 96% market share in commodity futures. NSE's cross-asset margin fungibility—allowing traders to offset margins across equity and commodity segments—provides capital efficiency advantages that MCX's commodity-only platform cannot match. When NSE announced aggressive commodity expansion in March 2026, MCX shares declined up to 3% intraday, reflecting market concerns about increased competition in a historically monopolistic segment. DRHP
Regulatory Provisions and Margin Resilience
NSE has faced significant regulatory headwinds, recognizing provisions of ₹1,391.21 crore in FY26 for colocation and dark fiber matters, plus ₹643.05 crore paid in FY25 for the TAP matter. These provisions substantially impacted reported EBITDA margins—reducing FY26 margins to 66.85% from a normalized 76.23%. However, the underlying business resilience is evident in normalized margins, which have remained stable at 76-77% across FY24-26 despite these one-off charges. DRHP +3
This margin stability contrasts with BSE and MCX profiles. BSE's 67% operating EBITDA margin reflects improvement but still trails NSE's normalized performance. MCX's margins exceed 70% but are more volatile due to commodity price cycles. The key difference is NSE's operating leverage—only 22.73% of operating expenses are fixed and unrelated to trading volumes. This means incremental revenue flows largely to profit, creating scalability advantages that competitors with higher fixed cost structures cannot match. InvestorPresentations
IPO Impact and Competitive Pressures
Jefferies' characterization of NSE as more "diversified" triggered an immediate 4% decline in both BSE and MCX shares on July 7, 2026. This market reaction reflects investor recognition that NSE's ₹30,000 crore IPO will complete the "trioka" of listed exchanges, fundamentally altering competitive dynamics. The IPO, entirely an offer for sale with no fresh capital, will bring NSE's market dominance to public markets at an estimated ₹5 trillion valuation.
The competitive pressures on BSE and MCX will intensify post-IPO. BSE faces valuation compression risk as NSE's superior growth metrics justify higher multiples. Jefferies has expressed caution on BSE, citing "stagnant market share". MCX must defend its commodity monopoly against NSE's cross-asset advantages while managing commodity cycle dependence. The market structure transformation will likely force both exchanges deeper into niche strategies—BSE in SME markets and data services, MCX in commodity specialization.
India-US Options Market Comparison
The comparison between Indian and US options markets reveals both current limitations and significant upside potential. India trades 84% of global equity options by volume but generates only one-fifth of US option premiums. NSE's total options premium reached $150 billion in March 2024 versus $598 billion for the US. This volume-premium disparity impacts revenue potential—India's high-volume, low-premium model generates less revenue per contract than the US market.
However, this gap also represents opportunity. India's index options premium of $135 billion represents 43% of comparable US contracts. With current low foreign portfolio investor participation (less than 10%), there's significant room for premium growth as the market matures. NSE's technology infrastructure, designed for high-volume low-value transactions, positions it to benefit from this premium convergence. BSE and MCX, with their scale limitations, are less positioned to capture this upside.
The linkage between option trading volumes and volatility rather than price movements creates revenue cyclicality risks for all exchanges. Option trading correlates with volatility—high uncertainty drives increased hedging and speculative activity. This means exchange revenues depend on market uncertainty rather than market growth, creating inherent cyclicality that affects NSE, BSE, and MCX differently based on their product concentrations.
Future Outlook
NSE's IPO will solidify its position as India's undisputed exchange leader. The combination of market dominance, clearing integration, technology superiority, and product diversification creates structural advantages that BSE and MCX cannot easily overcome. While BSE's aggressive pricing and MCX's commodity specialization provide niche opportunities, both face long-term competitive pressures in a market where NSE captures 70% of exchange revenues.
The critical question for investors is whether NSE's current valuation—potentially exceeding ₹5 trillion—prices in this competitive dominance or leaves room for growth as Indian options premiums converge toward international standards. For BSE and MCX, the path forward requires deeper specialization and operational excellence in their chosen niches, as direct competition with NSE across multiple asset classes appears increasingly challenging.