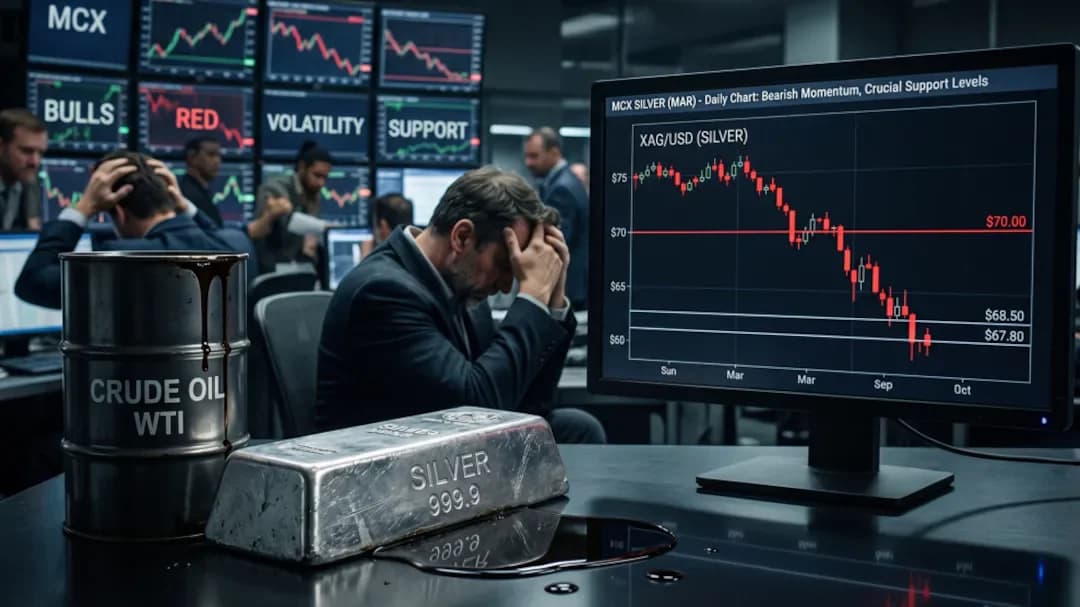
Silver prices experienced a significant decline, slipping 2.1% on Thursday to trade near $73, putting bears within striking distance of the $71 swing low. According to latest market data, the precious metal is now approaching a critical technical level that could determine its near-term direction. The price movement represents a substantial reversal from previous levels, with traders now focused on whether the $71 support level will hold or break. A break below this level would expose the long-term 0.618 Fibonacci retracement at $69, a zone that represents the next major support area.
The technical setup reveals a fourth test of the steep descending trendline that silver broke above on May 7. As reported by market analysts, the daily chart shows silver retested this support level on May 8, 19, and 20 before approaching for a fourth test. The daily RSI sits at 43, testing an ascending trendline that has guided momentum since late March. A clean bounce from this level would maintain the neutral-to-bullish structure, while a break would mark the first failure of this trendline in two months. The 4-hour RSI has dropped to 36, deep into bearish territory, signaling strong directional conviction behind the current decline.
The confluence at $71 makes this level the most important on the chart, stacking the swing low, descending trendline retest, and gateway to deeper Fibonacci support into a single zone. A hold at $71 would preserve the bullish reclaim and keep the door open to a retest of $83 resistance, with the 0.382 Fibonacci retracement at $89 becoming the next upside target. However, a loss of $71 would change the picture entirely, with the next major buyer interest sitting at the long-term 0.618 Fibonacci near $69, a zone last seen during the February crash to $63. The 4-hour Bollinger Bands are expanding sharply as price slides toward the $71 floor, with the lower band pushing down toward $72.
Macro pressure adds weight to the bearish setup, with Fed rate-cut odds for June collapsing from 48% to under 8% after the hot April CPI print. This shift has lifted the dollar and pressured dollar-denominated metals. Additionally, silver has lost its safe-haven bid this week as oil prices ease on US-Iran negotiations, turning focus back to industrial demand, which has softened with weaker manufacturing data. The 4-hour chart shows price breaking beneath the middle band on May 27, signaling that the consolidation around $76 had failed, with sellers controlling every candle close since.
According to The Financial Express, silver prices showed minimal variation across major Indian cities on May 27, 2026. Mumbai maintained the lowest price at ₹267 per gram, while Ahmedabad was slightly higher at ₹268 per gram. Bangalore, Chennai, Delhi, Hyderabad, and Surat all traded at ₹268 per gram, indicating uniform pricing across most metropolitan markets. The uniformity suggests stable regional pricing despite the overall market decline and current technical pressures.