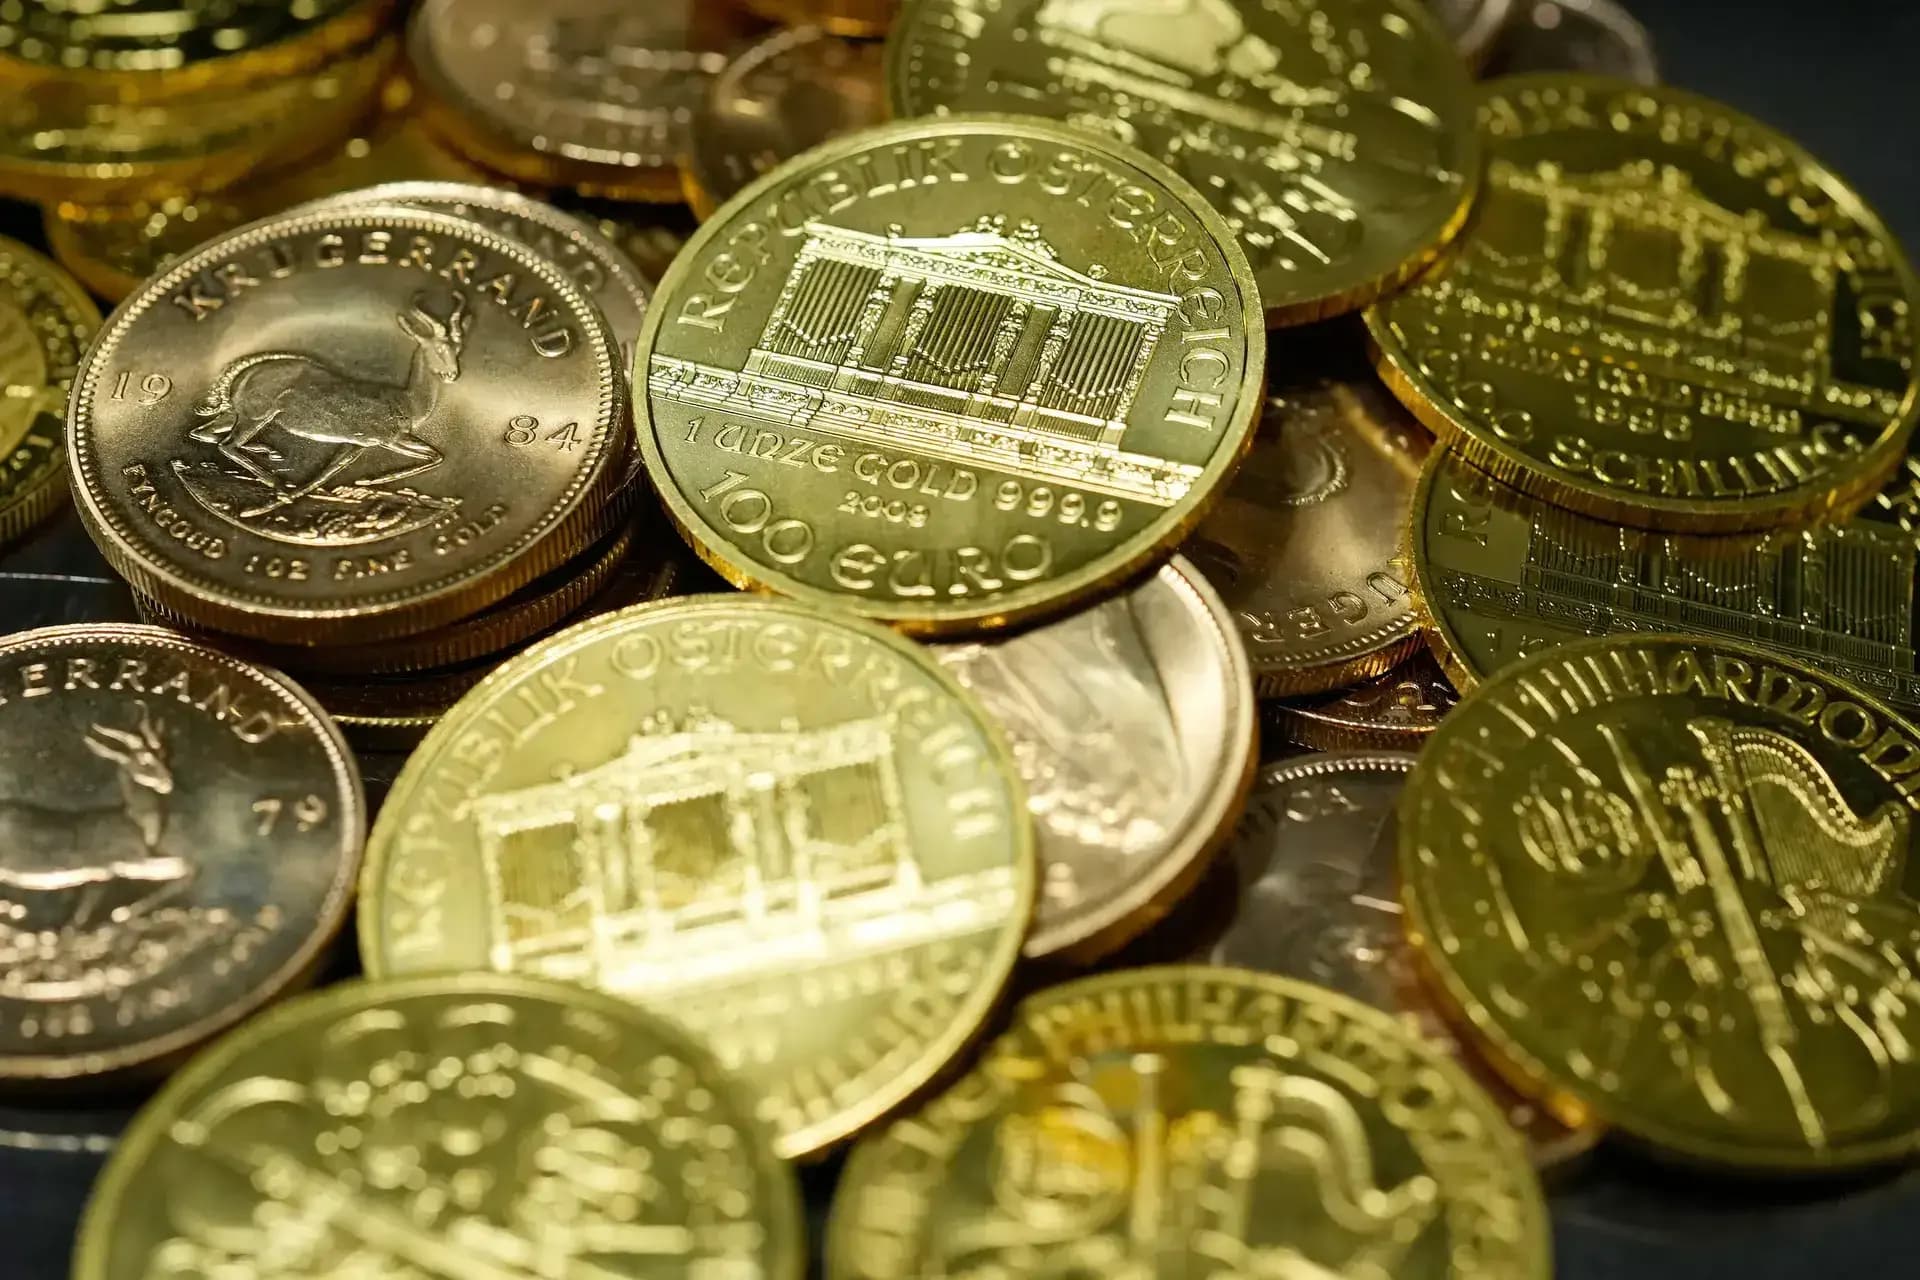
The Reserve Bank of India (RBI) repatriated over 100 tonnes of gold to India in the six months to March, bringing the total gold reserves stored locally to 680 tonnes. As per Mint, at the end of March, the central bank had 880.52 tonnes of gold, largely unchanged from a year ago. RBI's total reserves stood at $698.5 billion as of April 24, representing an increase of $10 billion over the past year. The share of gold in total reserves has increased significantly, with gold accounting for 17% of total reserves as of March 2026, up from 12% in April 2025, 8.7% in April 2024, and 7.8% in April 2023. This strategic repatriation reflects broader global trends where central banks are bringing gold reserves home to reduce exposure to geopolitical risks and sanctions.
According to a recent Deutsche Bank report, gold prices may soar to $8000 within five years, driven by emerging market central banks accumulating gold and shifting away from the dollar. The bank suggests this potential upside is tied to a broader trend where gold's share in global central bank reserves has doubled in the past four years to nearly 30%, with the gap between the dollar and gold now just 10%. As reported by Deutsche Bank, even in an environment where EM FX reserves decline to $5 trillion, gold prices could still rise to $8000 over the next five years, if EM countries all target a 40% gold share. The report emphasizes that central bank buying pushes gold prices higher, which in turn increases gold's share in reserves, reinforcing the trend further.
The bullish case for gold rests on three core drivers: rising central bank purchases, increasing gold prices, and a potential decline in foreign exchange reserves. According to Deutsche Bank, emerging market central banks have been the biggest buyers of gold since the 2008 financial crisis, adding over 225 million troy oz over the past 17 years, more than what advanced economy central banks sold in the 1990s. The World Gold Council reported that central banks added to their gold holdings at the fastest pace in more than a year during Q1 2026, with net purchases of 244 tonnes, up 3% year-on-year. The National Bank of Poland was the largest purchaser in Q1 2026, increasing its gold reserves by 31 tonnes to 582 tonnes. This strategic accumulation reflects deeper concerns about the global financial system, with geopolitical tensions, sanctions risk, and the weaponisation of the dollar-based financial system making gold more attractive. Madan Sabnavis, chief economist at Bank of Baroda, noted that countries now prefer to keep their gold reserves at home to demonstrate sufficient firepower during crises and to exclude reserves from global sanction nets.
The current decline in gold prices is primarily attributed to rising U.S. Treasury yields, with the 10-year yield climbing to 4.42% from 4.38% at Friday's close. The U.S. Dollar Index remains firm at 98.32, with risk-aversion flows piling into the greenback rather than rotating into gold. CME Group data shows just a 5.1% probability of a rate cut to 3.50-3.75% in June, while 94.9% of market participants expect rates held steady. The Federal Reserve's four policymakers dissented at the prior meeting—the highest dissent count in years—indicating internal FOMC divisions over inflation management. Higher-for-longer rates don't kill gold, but they cap its upside potential, with the 200-day moving average at $4,564.83 serving as the critical support level that the market is currently testing. Gaura Sengupta, chief economist at IDFC First Bank, explained that central banks are increasing their gold reserves to diversify holdings away from US Treasuries, as yields on US Treasuries have risen, with revaluation losses on forex holdings when yields harden.
The technical structure shows gold trading below the SMA-20 at $4,717.37 and SMA-50 at $4,699.26, but still clinging above the SMA-200 at $4,564.83. The Relative Strength Index sits near 36, bearish but not yet oversold, while MACD has slipped into negative territory. Key support levels include $4,576.74 (immediate), $4,510 (April 29 low), $4,500 (late-March low confluence), $4,441.34, and $4,350 (March 26 low). Resistance levels are positioned at $4,609.57 (immediate pivot), $4,645.91, $4,660 (Friday's high), $4,701.55, and $4,717-$4,740 (SMA-20 plus volatility band). The probability map suggests gold holding between $4,500 and $4,740 as the dominant scenario, with a clean break above $4,740 triggering upside momentum toward $4,821-$4,881 and eventually $4,937-$5,000.
For investors, the current market dynamics highlight the bullish ingredients still on the table: central bank accumulation at the fastest pace in over a year, 244 tonnes of net Q1 buying, $193 billion in record Q1 demand value, Q1 bar and coin purchases up 42% year-on-year, Goldman/JPMorgan year-end targets of $5,400-$6,300, Deutsche Bank's 5-year $8,000 projection, persistent Hormuz tail risk, and deep policy divisions inside the Fed. However, bearish ingredients are currently running over the bull case: U.S. 10-year yield at 4.42% and rising, dollar index firm at 98.32, 94.9% probability the Fed holds rates steady through June, technical breakdown below SMA-20 and SMA-50, MACD in negative territory, RSI at 36 with room to fall, Brent crude at $111+ keeping inflation expectations elevated, and gold having shed 13% since the Middle East war began despite safe-haven setup. The consensus has gold between $5,400 and $6,000 by month-end, contingent on catalysts that break right, with the longer-term case for $5,400 (Goldman), $6,300 (JPMorgan), or even $8,000 (Deutsche Bank within 5 years) levels remaining intact once the Fed pivots. According to the World Gold Council, central bank buying is expected to remain solid at levels close to 2025, with the continued geoeconomic risks providing additional upside potential.