Sign in to fuzzto save your conversations, follow your research and come back anytime.

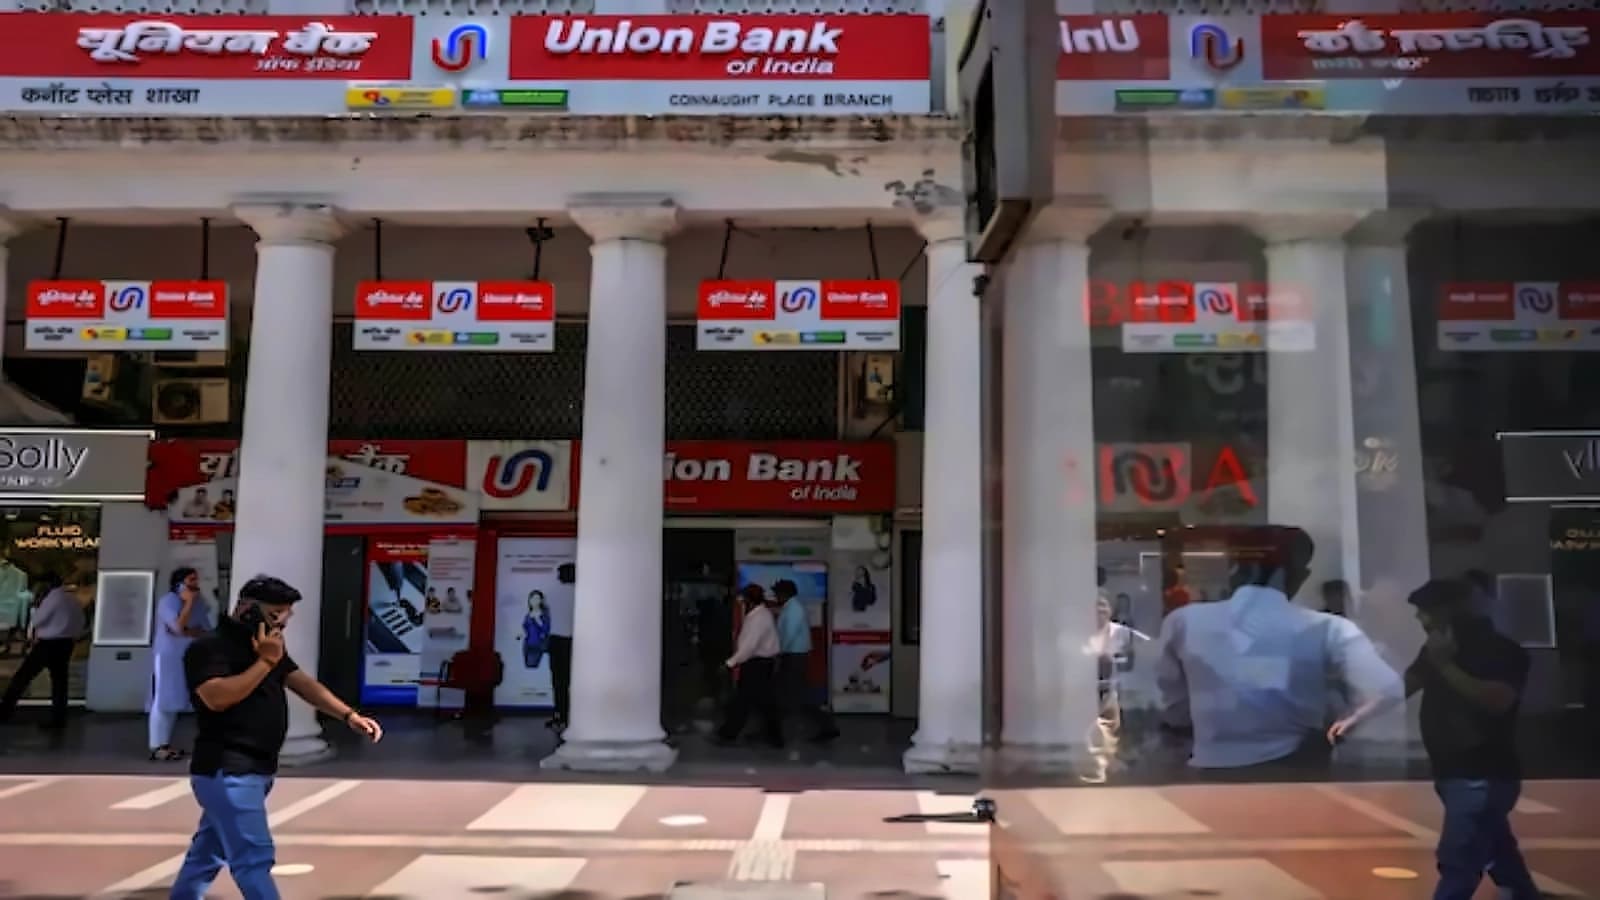
Union Bank of India is a major state-owned bank in India, with the government holding 74.76% of its share capital. It offers a wide range of services including retail and corporate banking, treasury operations, and international banking. The bank has a significant domestic presence with over 8,400 branches and 8,900 ATMs across India, as well as international operations with branches in Hong Kong, Dubai, and Sydney. Union Bank of India was originally incorporated in 1919 and nationalized in 1969. In 2020, it underwent a major amalgamation, merging with Andhra Bank and Corporation Bank to become the 5th largest public sector bank in India. As of March 31, 2024, the bank's global business stood at Rs. 21,26,912 Crore, with total deposits of Rs. 12,21,528 Crore and gross advances of Rs. 9,04,884 Crore.
In the news
Union Bank advances grow 18.5% to ₹11.56 lakh crore in Q2

Banking sector faces strike disruptions as PSBs warn of impact

HDFC Bank, Union Bank challenge NCLT ruling on Zee debt

Stocks to Watch: HDFC Bank, Vedanta, NBCC Lead Q1 Updates

PSB Consolidation and FDI Liberalization: A New Era for Indian Banking

PSB Consolidation: From 27 to 5 Banks, What's at Stake?

PSB Consolidation: The Road to Global Competitiveness

FII Investment Patterns: Selective Buying Amid Record Selling

PSU Banks: Strong Growth, Weak Market Sentiment
The Quarter story
The two most recent quarterly results, compared side-by-side.
Union Bank of India shows strong profitability and improving asset quality, though MSME credit stress and rising NBFC exposure need monitoring.
CASA Ratio climbs from 32.52% to 35.10% from Q1 FY26 to Q1 FY27, securing a stable low-cost funding base.
MSME Gross NPA rises from ₹6,348 Cr to ₹6,863 Cr from Q1 FY26 to Q4 FY26, signaling mounting credit stress in the small business segment.
Retail GNPA % drops from 1.19% to 0.99% from Q1 FY26 to Q4 FY26, reflecting strong credit discipline in consumer lending.
NBFC and HFC Portfolio Balance jumps from ₹1,27,660 Cr to ₹1,64,839 Cr from Q1 FY26 to Q4 FY26, indicating aggressive lending to financial intermediaries.
Large Corporate Gross NPA falls from ₹10,795 Cr to ₹4,820 Cr from Q1 FY26 to Q4 FY26, highlighting successful risk mitigation efforts.
MSME Fresh Slippages rebound from ₹728 Cr to ₹895 Cr from Q3 FY26 to Q4 FY26, warranting closer monitoring of small business credit health.
Cost to Income Ratio improves from 49.19% to 46.31% from Q1 FY26 to Q4 FY26, demonstrating better operational efficiency.
Agriculture Fresh Slippages rise from ₹552 Cr to ₹742 Cr from Q3 FY26 to Q4 FY26, reflecting seasonal crop cycle volatility.
CRAR recovers from 16.49% to 18.46% from Q3 FY26 to Q1 FY27, ensuring robust regulatory capital buffers.
Agriculture Share of Advances eases from 18.29% to 17.3% from Q1 FY26 to Q1 FY27, showing gradual portfolio rebalancing away from farm lending.