Sign in to fuzzto save your conversations, follow your research and come back anytime.

In the news
Solar Industries' ₹12,951 Crore Deal Triggers Defence Index Slide

MTAR Technologies Eyes 'Sizable' Orders After ₹1.1L Cr Defence Approval

MTAR Tech hits 5% upper circuit on Bloom Energy S&P 500 entry

India's Private Space Startups Achieve Historic Milestone with First Rocket Launch

MTAR Technologies shares rally 3% on ₹127-crore nuclear order win

Four multibagger stocks deliver up to 525% returns in 2026

MTAR Tech hits upper circuit for 4th session post Q1 results

Motilal Oswal picks 3 stocks with 28-38% upside potential

MTAR Technologies Q1FY27: Revenue Doubles, Margins Expand, But Bloom Energy Dependence Looms Large
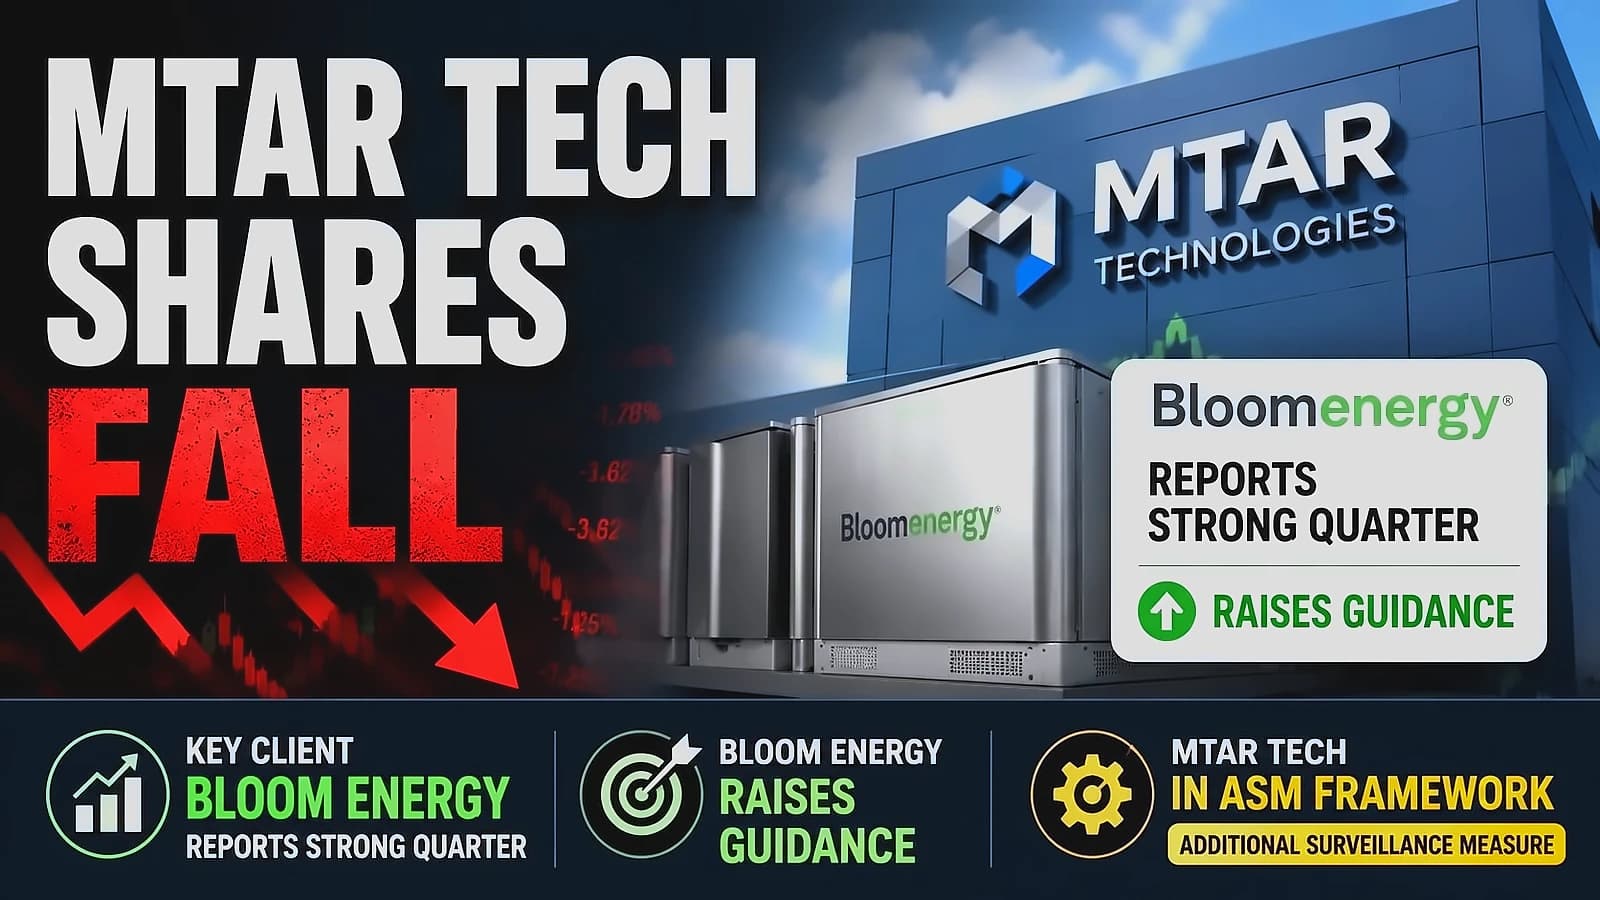
MTAR Tech hits 5% upper circuit for second straight day on strong Q1

Weekly Top Stock Picks: 10/10 Score Companies with 18-71% Returns

Market Experts Share Stock Recommendations: L&T, Avenue Supermarts, Others

Defence electronics to lead growth phase; PL Capital picks Bharat Electronics

Experts' Stock Picks: Buy Britannia, Hold ITC, MTAR

Govt Waives Customs Duty on Nuclear Power Goods Till Jan 2026

MTAR Technologies: The Bloom Energy Dependency Dilemma

MTAR Tech vs Apollo Micro Systems: Defence stocks rally 395%-185%

MTAR Tech shares drop 3% after 24% rally to record high

MTAR Tech hits all-time high on ₹467 cr order win

MTAR Technologies shares hit record high on ₹467 crore order win
The Quarter story
The two most recent quarterly results, compared side-by-side.
MTAR Technologies posts strong revenue and profit growth driven by a massive surge in new orders and sharply improved working capital efficiency.
Consolidated revenue grew from ₹156.6 Cr to ₹360.7 Cr from Q1 FY26 to Q1 FY27 — driving consistent top-line expansion
Cost of materials consumed rose from ₹92.8 Cr to ₹204.3 Cr from Q1 FY26 to Q1 FY27 — pressuring gross margins
New orders surged from ₹105.3 Cr to ₹2,895.1 Cr over five quarters — securing strong multi-year project visibility
Finance costs climbed from ₹5.8 Cr to ₹15.8 Cr over five quarters — weighing on net profit margins
Total working capital days fell from 267 to 59 from Q1 FY26 to Q1 FY27 — signaling major cash flow efficiency
Supplier payment days rose from 87 to 168 from Q1 FY26 to Q1 FY27 — indicating slower payments to vendors
EBITDA margin expanded from 18.1% to 23.6% over the period — confirming strong pricing and operational leverage
Gross profit margin slipped from 54.2% to 45.5% over the period — showing ongoing cost pressure
Receivable days dropped from 126 to 82 from Q1 FY26 to Q1 FY27 — accelerating cash collections from clients
Consolidated order book fell from ₹2,394.9 Cr to ₹100 Cr from Q3 FY26 to Q1 FY27 — warning of pipeline volatility
Company insights, generated from the most recent coverage.
MD publicly clarified that no customer communicated any reduction in committed business after media reports of order cancellations — but the unresolved chatter remains a sentiment risk in a high-multiple stock.
Management targets doubling aerospace and defence revenue in FY27; this segment is the highest-margin part of the mix, so any slippage hits the guided ~24% EBITDA margin disproportionately.
EBITDA margin jumped to 23.6% in Q1 FY27 from 19.5% for full FY26 and 20.2% in Q4 FY26 — margin expansion, not just volume, is driving the earnings story.