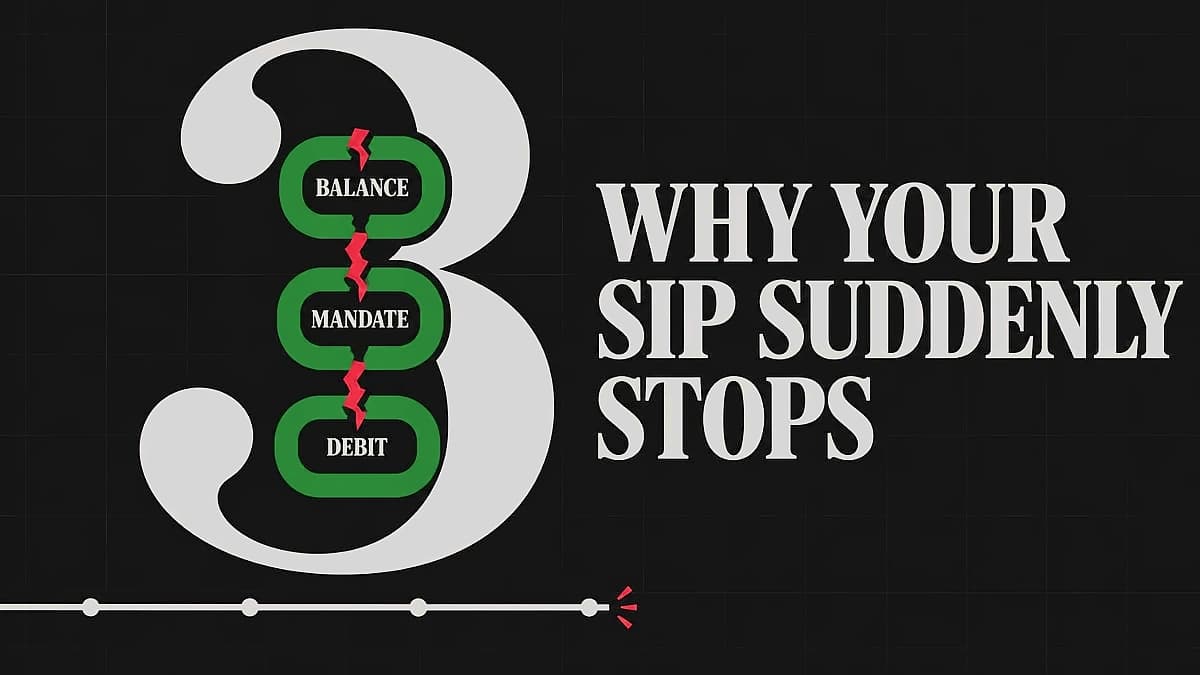
The mutual fund industry continues to witness concerning trends in SIP discontinuation rates despite record-breaking inflows. According to latest data, SIP inflows remain above ₹31,000 crore per month even as stoppages have crossed 100%, highlighting the paradox of sustained investment activity amid widespread discontinuation. Industry experts attribute this to stock market volatility, with SIPs running for less than two years growing close to 19% over the same period. The number of five-year-plus SIPs in direct plans, which carry lower expense ratios as they exclude distributor commissions, shrank by around 35% in FY26, while 3-4-year SIPs declined 56%. As per Wealth Edition, 41% of assets in direct plans are redeemed within the first year, and only 20% remain invested for over three years, compared with 32% in regular plans, with direct investors showing greater propensity to exit early.
The challenging market conditions have significantly affected SIP performance, with the Nifty 50 down over 6% from its peak on 26 September 2024 as of the latest data. Two years of range-bound markets have left SIP returns weak, with a SIP running in the Nifty 50 TRI for the past year barely positive, while a two-year SIP has returned about 2%. This poor performance has contributed to the SIP closure ratio averaging about 96% in the first quarter of FY27. According to Saugata Chatterjee, president and deputy CEO at Nippon India Mutual Fund, investors who came in over the last 12 to 24 months would have looked at returns of the preceding two to three years, but market conditions have been quite different from that period. Over the past 10 years, a monthly SIP in the average equity fund fetched 15.93% in direct plans and 14.78% in regular plans, with the rupee value gap resulting in ₹2.03 lakh shortfall for regular plan investors. As per Wealth Edition, the real cost of DIY investing shows up not in expense ratios, but in investor behaviour, with the silent behavioural 'tax' often outweighing the visible cost difference between direct and regular plans.
Data from rolling returns analysis reveals the power of long-term SIP investing despite current market challenges. For Nifty 50, 14.2% of two-year SIP periods ended in the negative, falling to 5.9% at three years and 0.5% at five years. The Nifty Midcap 150 showed similar trends with 18.5% of two-year SIPs losing money, compared with 2% at five years and none at seven years. Small-caps, which tend to be more volatile, show the same pattern with 24.9% of two-year SIPs losing money for Nifty Smallcap 250, falling to 8.6% at five years and 3.5% at seven years. Over longer periods, average SIP returns settle into a narrow band with five-year average rolling returns of 12.65% for Nifty 50. Wealth Edition notes that regular plan investors hold their mutual fund investments for longer than others, as the numbers demonstrate, with 41% of assets in direct plans redeemed within the first year compared to regular plans' 32%. Recent analysis by Mint shows that 10-year SIPs started at different points in each year—at the year's high, on the first trading day and at the year's low—show outcomes converge across all three indices, with starting at the year's high averaging 12.59% for Nifty 50.
Pausing SIPs carries significant costs that extend beyond the break period, with the latest data showing the impact of widespread stoppages. Considering a ₹20,000 monthly SIP targeting ₹1 crore with a 10% annual return, an investor two years into the SIP who stops for six months reaches the goal 4 months and 27 days later. A 12-month break stretches the delay to 9 months and 24 days. For someone four years in, a six-month break costs 4 months and 3 days, while a 12-month break costs 8 months and 3 days. Ravi Kumar TV, co-founder of Gaining Ground Investment Services, notes that younger investors often look at last one-year returns of a fund on apps and expect the same returns to continue, failing to link their investments to long-term goals. The rupee value gap between direct and regular plans becomes more pronounced as investing time horizons expand, with the shortfall widening significantly over longer periods, as highlighted by Wealth Edition which emphasizes that the visible cost difference between direct and regular plans is often outweighed by the hidden cost of poor asset allocation, wrong fund selection, panic exits, stopped SIPs and mistimed switches.

Financial experts emphasize the importance of maintaining SIP discipline despite market volatility and widespread stoppages. Top-up SIPs can help investors reach goals sooner, with a 5% annual top-up bringing the target to the 15th year and a 10% annual top-up getting there in the 13th year. Amol Joshi, founder of Plan Rupee Investment Services, recommends younger investors top up their SIP every time they get an increment, fixing the SIP as a percentage of salary. The analysis shows that 10-year SIPs started at different points in each year—at the year's high, on the first trading day and at the year's low—show outcomes converge across all three indices, with starting at the year's high averaging 12.59% for Nifty 50. As per Wealth Edition, SEBI-Registered Investment Advisers (RIAs) are mandated to recommend direct plans since they charge advisory fees rather than earning commissions, allowing investors to access professional guidance while maintaining lower costs. However, Wealth Edition notes that the additional cost is justified only when the adviser or distributor provides continuous and meaningful value, with a good money manager's real value being not just fund selection, but managing allocation, controlling risk exposure, and holding the investor's hand through volatile cycles.