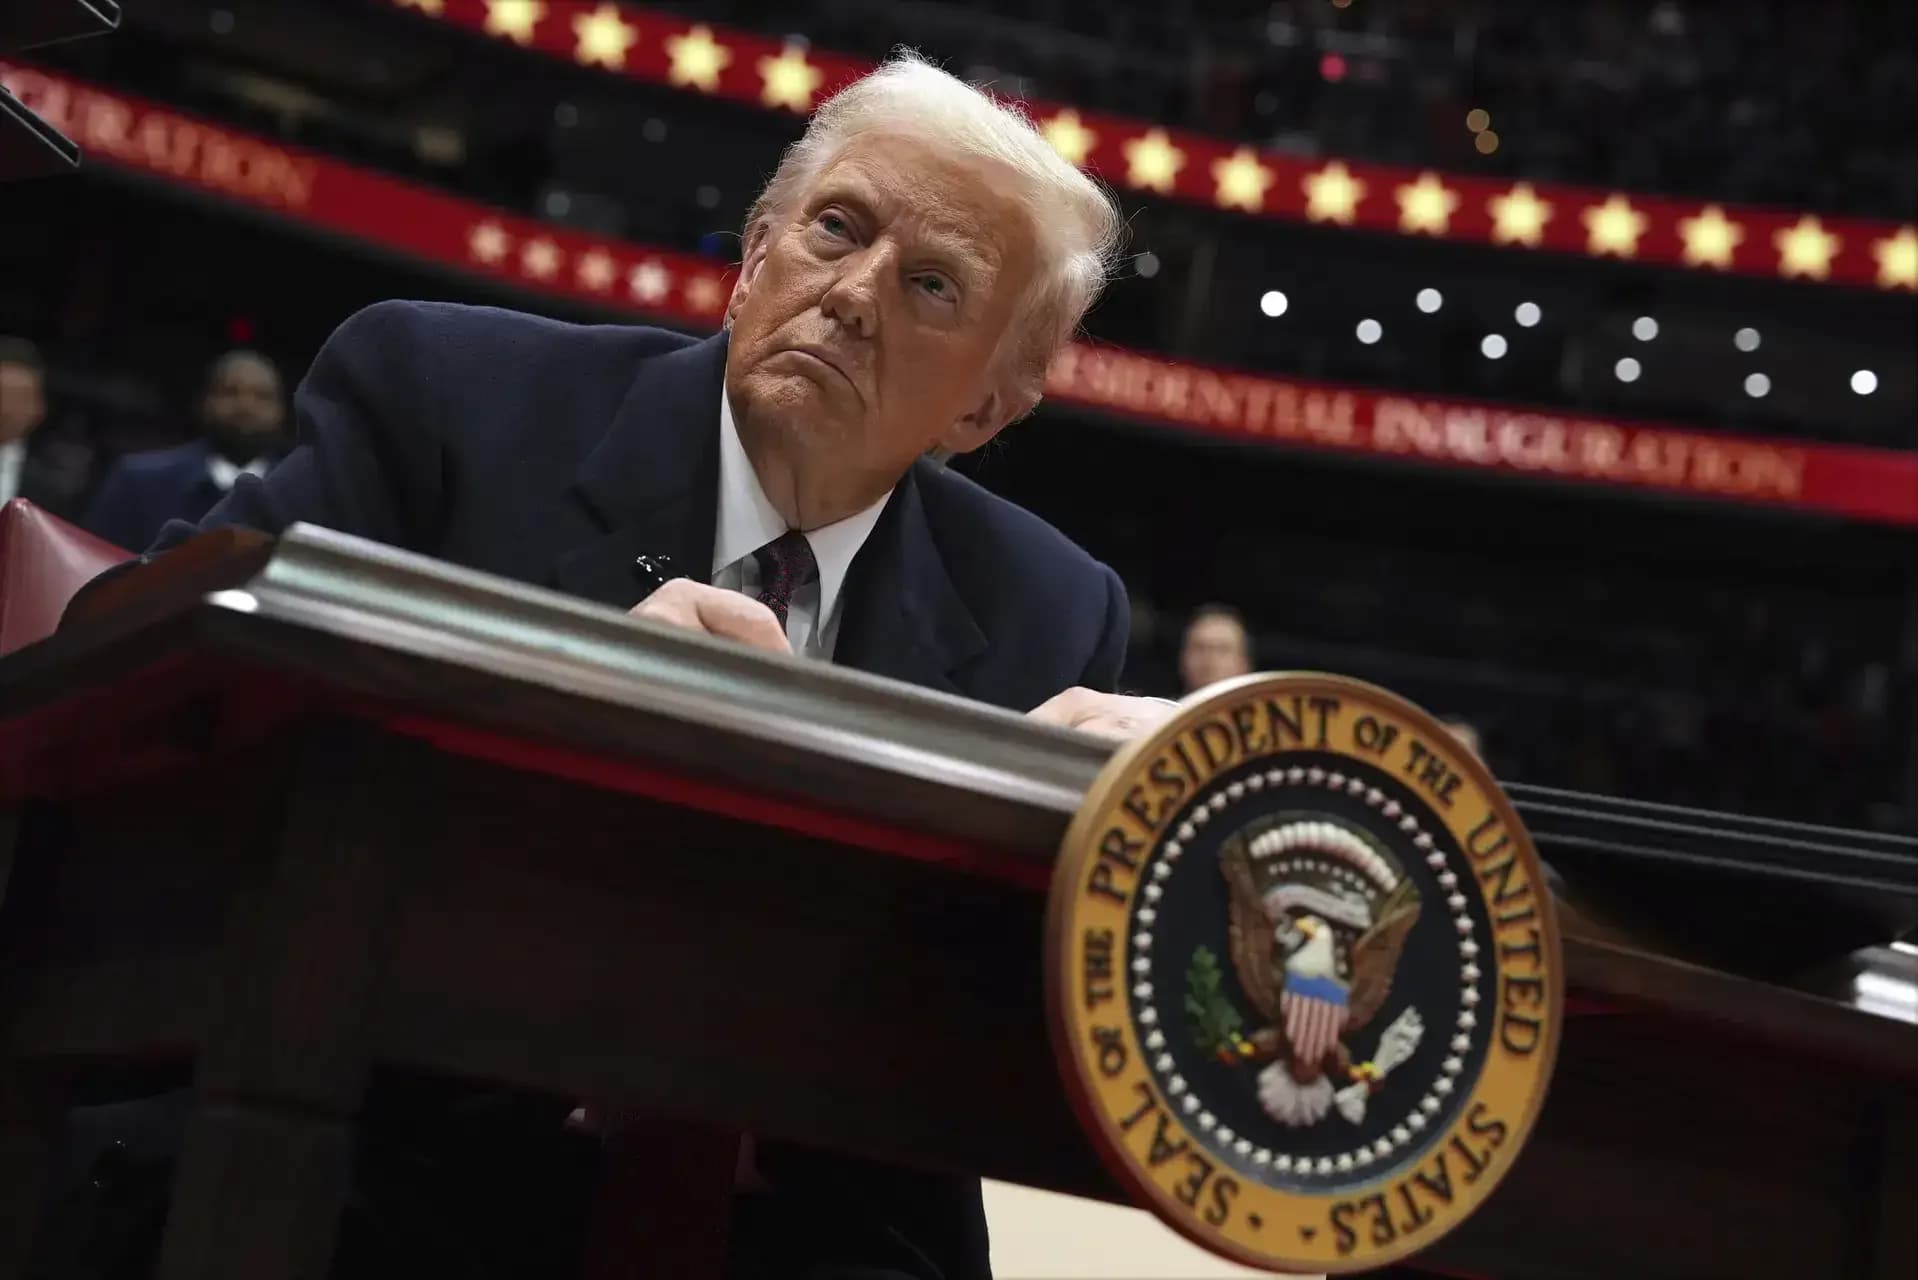
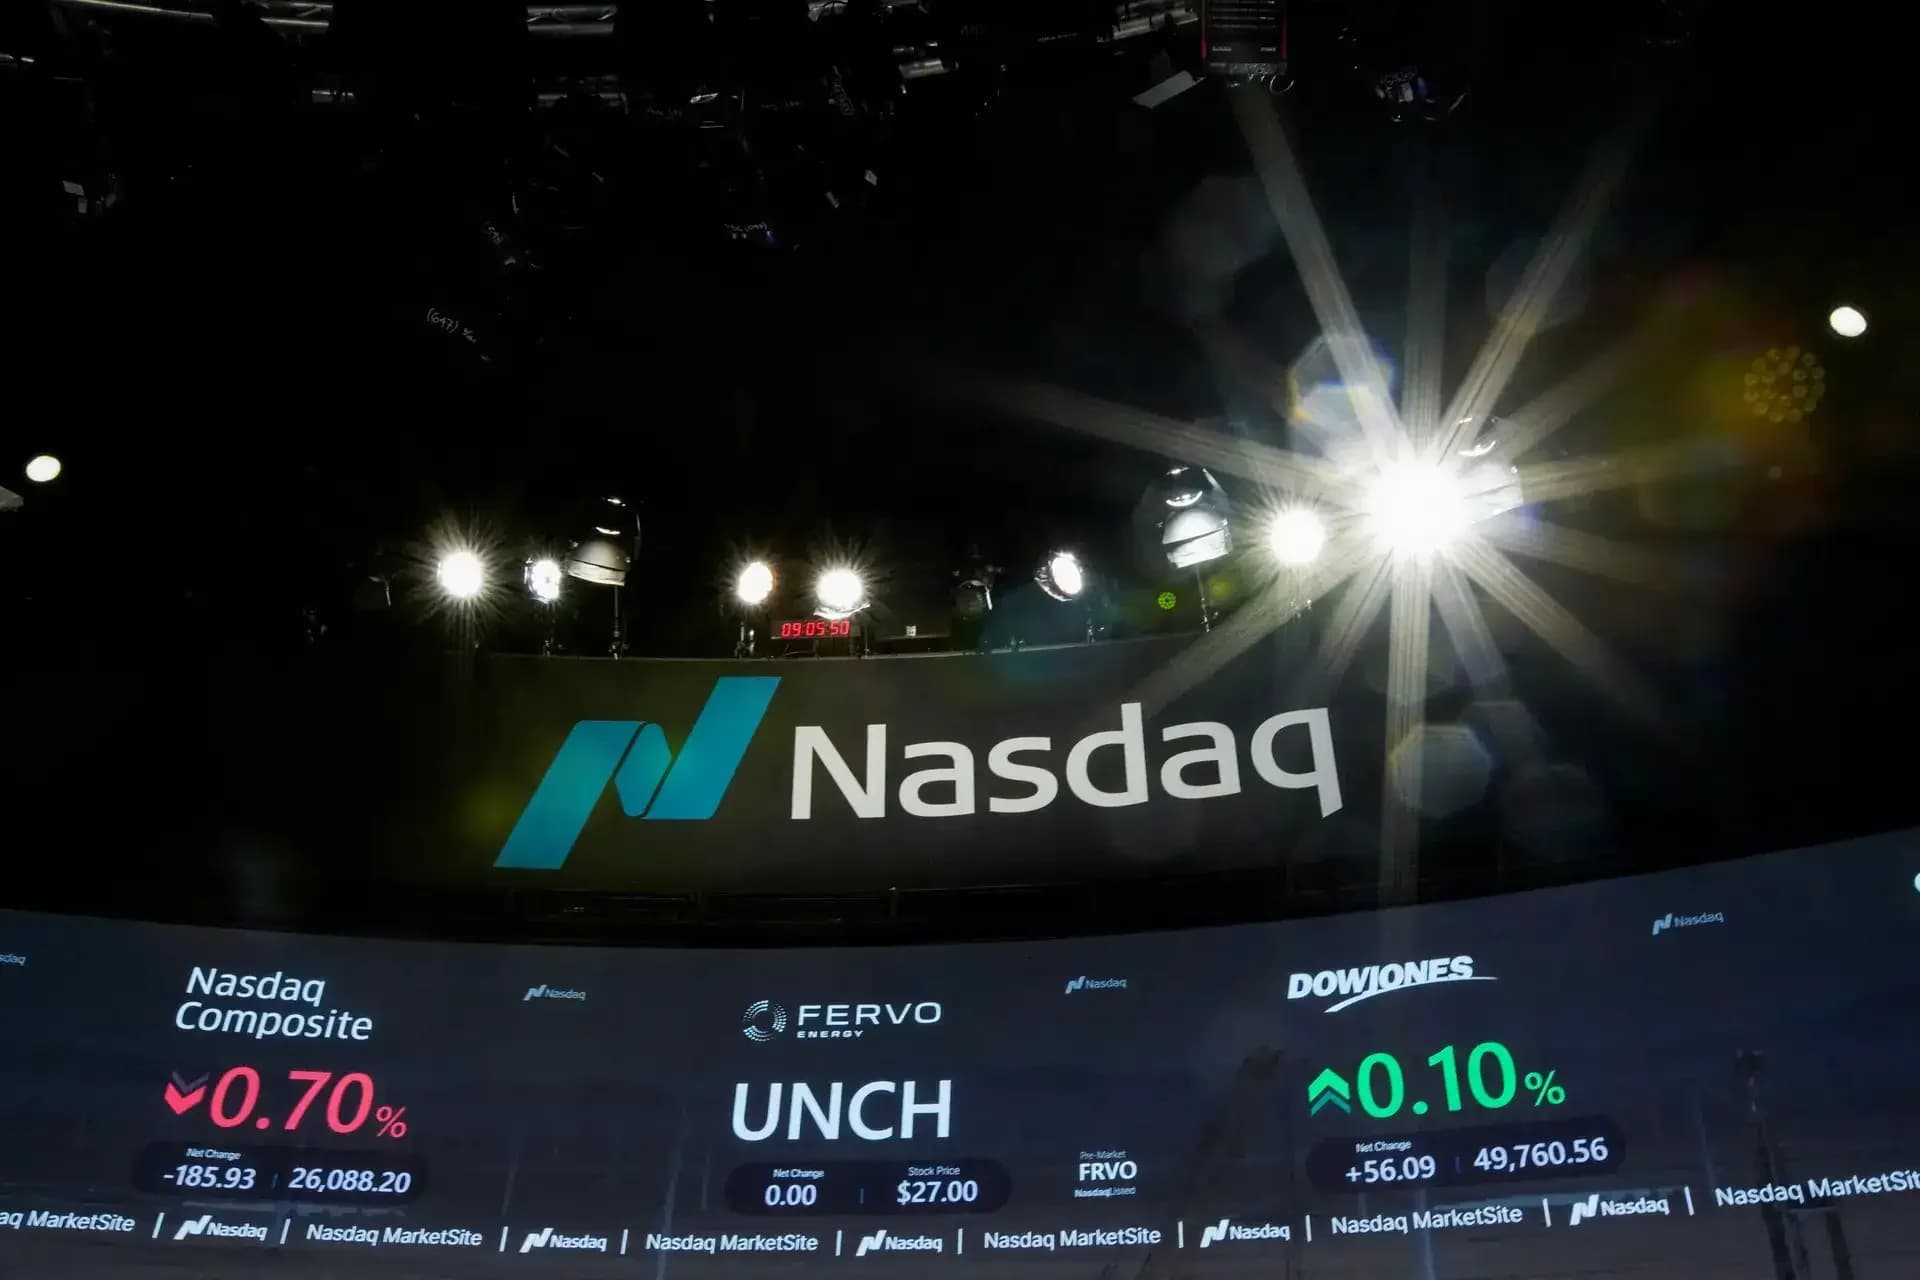
President Donald Trump's social media posts and public statements have become the primary driver behind the five best and worst days in the S&P 500 Index over the past 15 months, according to an analysis from Fundstrat Research. As reported by Bloomberg, this influence is unmatched by any modern American leader, with no other president orchestrating this many best and worst days in a dozen administrations going back to President Ronald Reagan in 1981. Hardika Singh, economic strategist at Fundstrat, stated that "the president isn't supposed to have such an extraordinary amount of control over the fortunes of the stock market. It's completely unprecedented." The market reaction has been immediate, with the president effectively holding the market "on a leash," as described by Fundstrat. According to Bloomberg, "Trump speaks every single day, and every single day he says something that seems to have an impact on the market."
The war in Iran has provided a perfect backdrop to demonstrate Trump's market influence, with the S&P 500 posting its fastest V-shaped drop and recovery since 2020. According to Bloomberg, the index tumbled 9% from a January 27 peak to the cusp of a technical correction on March 30, before rallying back to all-time highs over the course of 11 trading days. The impact is particularly clear in session-by-session analysis, where the S&P 500 sank 1.5% on March 20 as Trump said he didn't want a ceasefire with Iran, then jumped 2.9% on March 31 after Trump told reporters that negotiations with Iran were going well and the war was close to ending. The impact did not stop at equities, spreading across financial markets including bigger swings in commodity prices and oil volatility that approached levels seen at the start of the Covid-19 pandemic. As Bloomberg reports, "The whiplash strongly resembles last year's tariff-driven rout and subsequent rebound. Both episodes were tied to abrupt policy jolts from the president and unwound by equally abrupt backpedaling."
Among the S&P 500's best days during Trump's current term include the 9.5% rally on April 9, 2025, when he paused his tariffs, and the 3.3% jump on May 12, 2025, when the US and China agreed to a 90-day trade truce. Conversely, the worst days include the 6% plunge on April 4, 2025, after China retaliated with tariffs on the US, and the 4.8% drop on April 3, 2025, after the president first implemented sweeping levies. As reported by Bloomberg, since Trump took office, the S&P 500's five biggest up days and five biggest down days have all been tied to his comments on tariffs, a trade truce and Iran, with the impact spreading beyond stocks to commodities and oil prices. The president's influence has made him "the market's 'arsonist and firefighter,'" according to Alexander Altmann, head of global equities tactical strategies at Barclays.
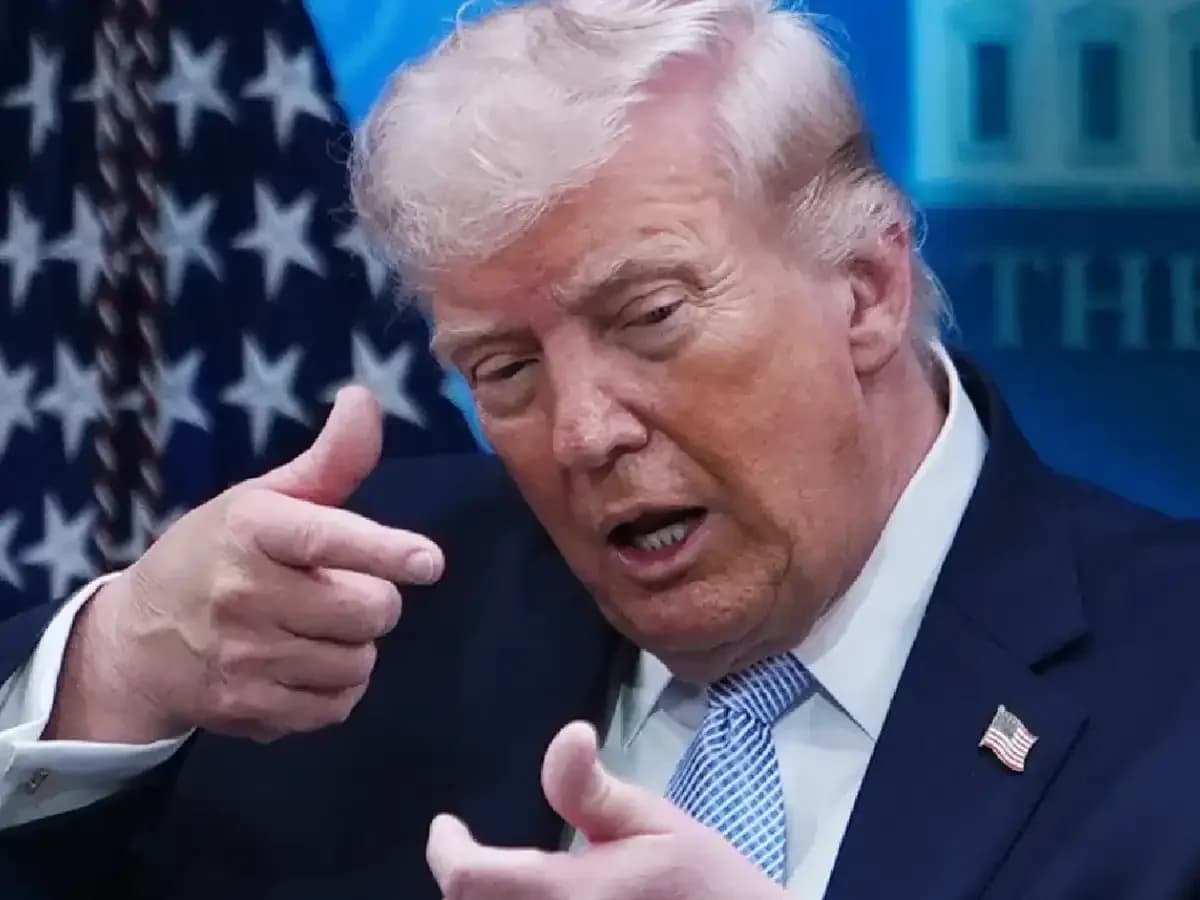
Veteran market strategist Ed Yardeni of Yardeni Research noted that "I have never seen a market that's been this moved by chatter coming out of the White House on a daily basis." According to Bloomberg, on Wall Street, some see the president's personal influence as expanding, with presidential remarks now driving market direction in place of economic data, interest rates and corporate earnings. Alexander Altmann from Barclays argued that "while the world may hang on to the unorthodox communication methods by the president, and anticipate a bout of market volatility in its wake, the reality is that markets are behaving in a consistent way with historic patterns." The rise of passive investing has made the market more reactive to news in general, with Michael Green, portfolio manager and chief strategist at Simplify Asset Management, estimating that markets are approximately four to five times more reactive than historically. Ross Mayfield, investment strategist for Baird Private Wealth Management, noted that "Investors have been conditioned, not wrongly, to expect that if things get too bad, especially if it's administration induced...they're waiting for the tweet that says, actually, we're good."
Despite the perception of increased volatility, analysis contradicts this idea when examining volatility measurements. As reported by Bloomberg, the average value of the Cboe Volatility Index (VIX) across the entire term of each president since the inception of the gauge in 1990 is 19.3, precisely in line with Trump's second term and with President Joe Biden's term. Alexander Altmann from Barclays stated that "the reality is that markets are behaving in a consistent way with historic patterns," with the medium of high-cadency social media being the primary factor rather than the magnitude of reactions. There is also a counterargument that structural factors, including the rise of passive investing and greater sensitivity to news, may also be contributing to market volatility. The president's influence extends beyond traditional market communications, with official White House social media channels now using platforms to address market moves, posting animated graphics to tout S&P 500 records or telling Wall Street not to be "panicans" when Trump's words or policies spark fears.