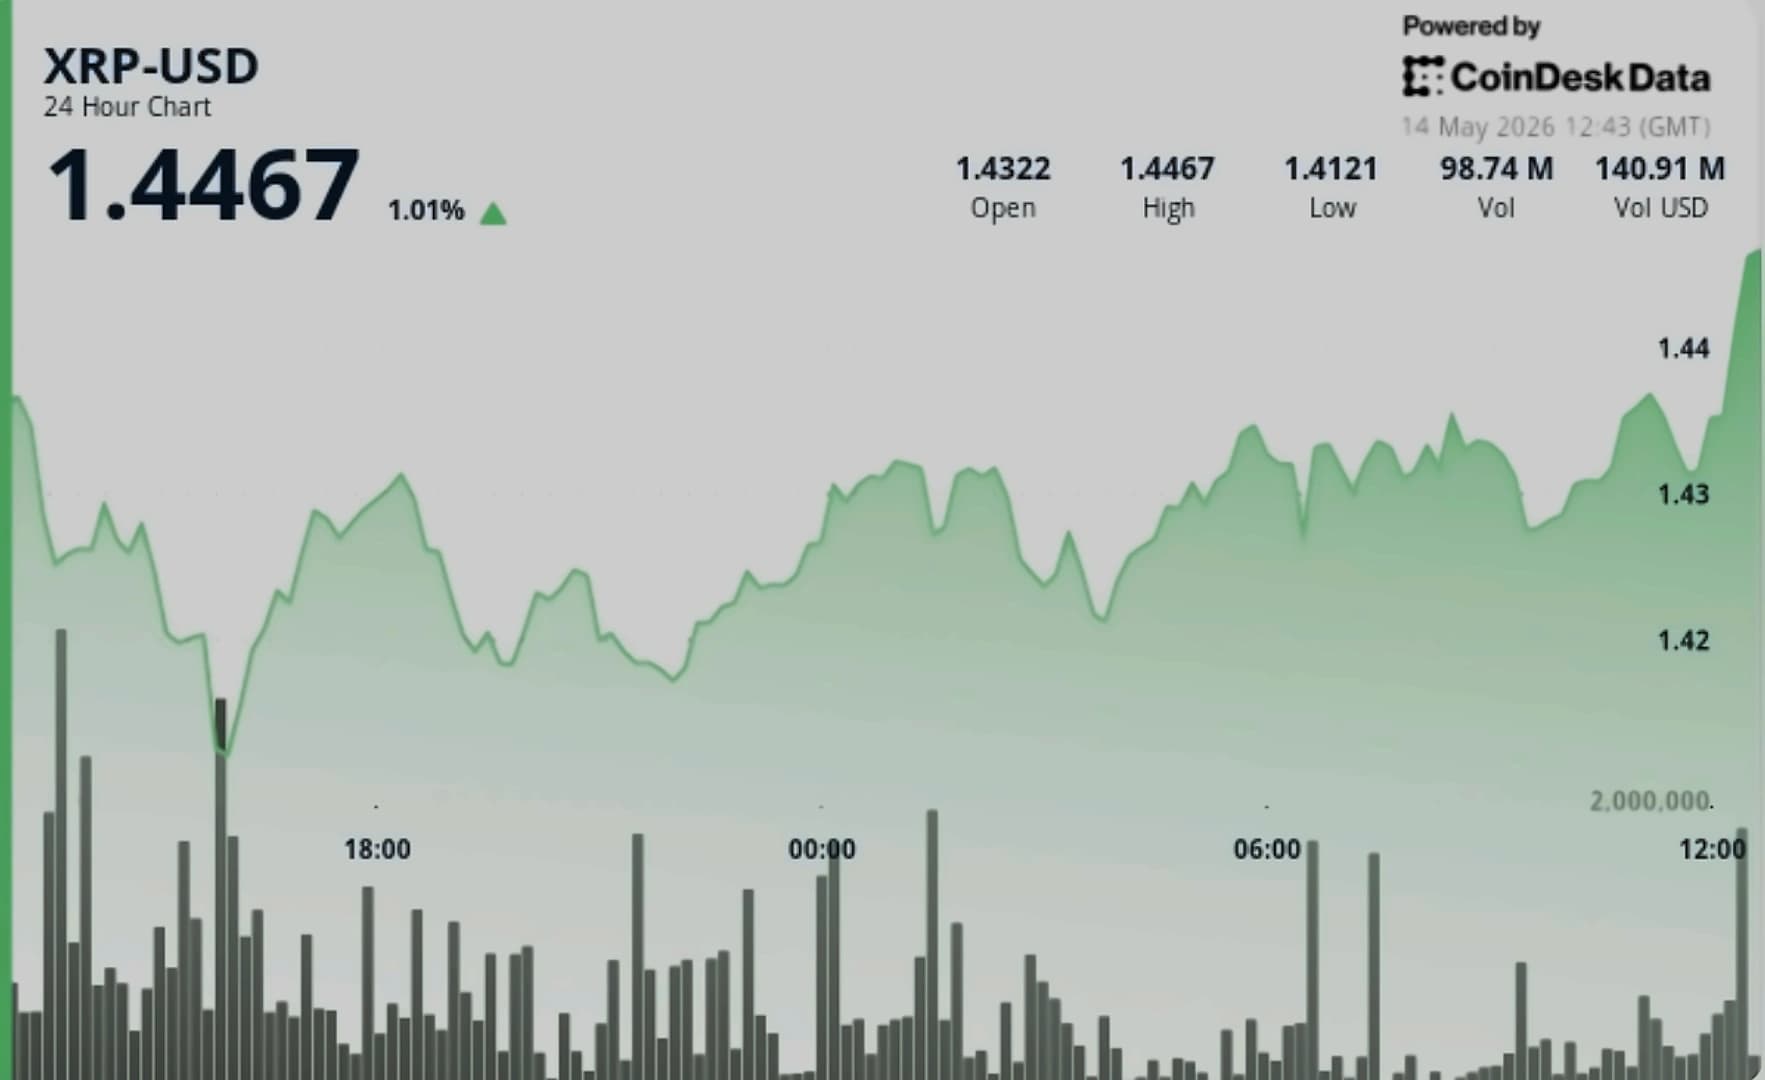
XRP is currently trading at $1.43 as the token settles into a tight range after last week's dramatic fireworks. According to latest analysis, the cryptocurrency has stalled 4.5% off yesterday's levels and is well below the $1.7 high printed during the breakout top. The token is experiencing a violent round trip after erasing its most bearish technical signal last week and ripping 46% in seven days, briefly pushing past a $91 billion market cap and touching $1.55 intraday. However, the latest daily candle closed at $1.45 after opening near $1.48, with the spot subsequently grounding lower to current levels. Volume has thinned noticeably compared to the vertical leg from the $1.00 August low, a pattern typical of relief rallies losing steam rather than trends reversing outright.
Short-term pivots place immediate support near $1.31–$1.30, with layered resistance stacking from $1.51 up to $1.62. The Average Directional Index hit 44.8 during the recent run, confirming genuine trend strength rather than noise. However, the pair is currently trading in an unusually narrow intraday band, reinforcing the indecision. If XRP can reclaim $1.50 on rising volume, it can retest $1.62, or continued chop might happen between $1.30 and $1.50 while the market digests the prior leg. A break below $1.30 drags the price back toward the $1.00 floor, which remains the structural floor that matters most. The daily pivot sits at $1.49, creating a coin flip zone for traders, with a clean break below $1.45 opening the door to the 0.382 Fibonacci support at $1.35-$1.40.
Despite extreme greed returning to crypto markets for the first time since 2024, XRP's pullback shows that sentiment alone doesn't override exhausted momentum. The 4-hour RSI stands at 58.73, down from recent overbought territory, while the MACD line has fallen below its signal line with a negative histogram reading of -0.0156, indicating weakening upward momentum. However, the Chaikin Money Flow indicator remains positive at 0.08, showing continued buying pressure despite the pullback from $1.69. The Chaikin Money Flow indicator remains positive at 0.08, showing continued buying pressure despite the pullback from $1.69. The daily pivot sits at $1.49, creating a coin flip zone for traders, with a clean break below $1.45 opening the door to the 0.382 Fibonacci support at $1.35-$1.40. A sustained break below $1.3672 would invalidate the current bullish pennant formation.

XRP experienced a significant 14% pullback from its $1.70 local top, closing at $1.46 in the latest trading session. According to AMBCrypto data, this represents the largest drawdown among top high-cap cryptocurrencies, with the decline following a brutal $250 million in long position liquidations that accounted for over 72% of all crypto market liquidations. The crash occurred despite XRP's impressive 46% weekly gain and formation of a long upper shadow at $1.70, marking its highest price in more than seven months. The liquidation wave affected XRP more severely than other major cryptocurrencies, with the flash crash representing a critical reality check for the bullish setup that had dominated the week.
The liquidation wave affected multiple major cryptocurrencies during the same timeframe, with Bitcoin falling 2.5%, Ethereum dropping 5%, and Solana sliding 11.5% during the same window as XRP's crash. According to Coinglass data, $1.35 billion was liquidated from the crypto market over the past 24 hours, with the bulk of activity concentrated on Binance. The liquidation mechanism occurs when exchanges forcibly close leveraged positions because traders can no longer cover potential losses. The drop highlights how high leverage and thin market liquidity can amplify sudden price moves across the entire crypto ecosystem, with XRP bearing the brunt of the correction despite its strong weekly performance.