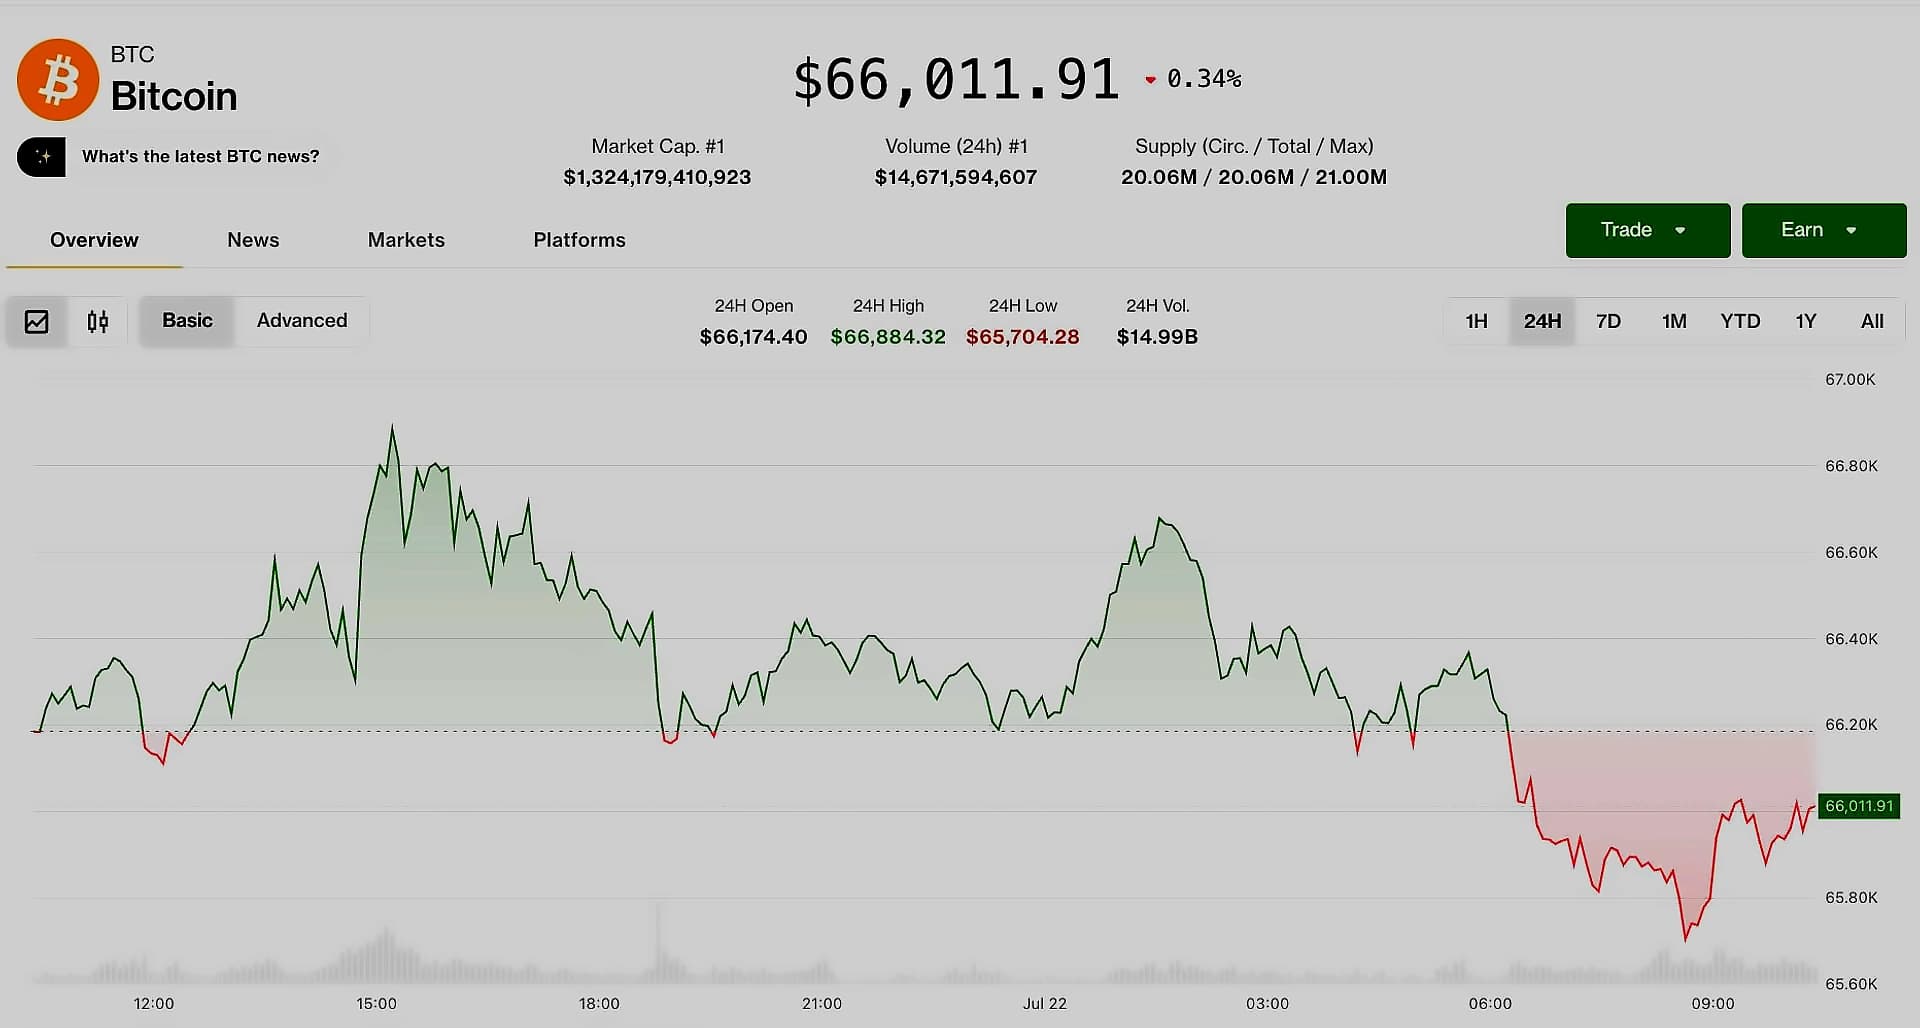
Bitcoin traded at $64,500 after spending almost three months in a contracting range, with the cryptocurrency holding above its $63,200 median realized price as support during repeated tests over the past two weeks. According to latest market data, the cryptocurrency printed a high of $63,512 against a low of $62,667 on $12.74 billion of volume, with market capitalization near $1.27 trillion. The 20-period exponential moving average sits near $63,713, the 50-period near $64,265, the 100-period near $66,334 and the 200-period near $71,578, with Bitcoin trading beneath all four. The 50-day simple moving average sits at $63,392 and the 100-day at $67,628, with the $63,900 level having functioned as pivot resistance through multiple attempts. Bitfinex analysts identified $67,176 as the breakout level that could raise the chances of an upside volatility expansion, noting that a move above this level would return recent buyers to profit while placing BTC against the next area of overhead supply.

Bitfinex analysts told crypto.news that Bitcoin's prolonged defense of its median realized price has increased the probability that its next large move could favor buyers, although weak ETF demand and falling stablecoin supply have left the potential rally without fresh liquidity. The analysts noted that price has sustained over the Median Realised Price despite repeated tests and signals hinting at late bear market conditions, suggesting higher odds that volatility expansion breaks to the upside. However, they warned that failure to hold $63,200 would weaken that setup, with Bitfinex identifying $57,803 near Bitcoin's June and bear-market lows as the next major downside area if sellers break the median realized price. Farther below, the aggregate realized price at $52,699 represents the analysts' long-term market floor, where the average holder base would approach an underwater position.
US spot Bitcoin ETFs recorded $385.2 million in weekly net outflows, with the institutional demand weakness extending to a difficult period for US-listed Bitcoin funds. According to Bitfinex data, spot Bitcoin ETFs lost $5.4 billion during the first half of 2026, with July bringing only $205 million in net inflows after ending the run of monthly losses. The 'Two-Complex Spot Bid', which tracks ETF and corporate treasury activity, produced its first fully negative reading as both groups became net sellers during the same week. Corporate treasury demand also turned negative after Strategy recorded a third consecutive week of divestment, including the sale of 1,690 BTC. The IBIT holds 734,261 BTC at a cost basis near $83,080, carrying a $17.61 billion unrealized loss and representing 29.2% above spot.
Compressed volatility has coincided with exceptionally weak trading and network activity, with coin-adjusted spot exchange volume falling to levels last recorded in early 2019 when measured across major platforms. Binance-only volume, which removes distortions caused by the exchange's introduction of zero-fee trading in 2022, has approached depths associated with the 2023 bear market. Bitcoin transfer velocity has reached a seven-year low, indicating that coins are changing hands less frequently. Bitfinex analysts noted that 'minimal flows exert disproportionate influence on price action', with modest bidding able to spark a rally just as readily as minor selling triggers a breakdown. The Fear and Greed index sits at 38 out of 100, a fear reading, after improving from 24 to the mid-30s across the prior week, while the Altcoin Season indicator stands at 46 out of 100.
Bitcoin's recent price rise towards $65,000 is likely driven by shifting Federal Reserve policy expectations rather than on-chain developments. As reported by CoinDesk, Goldman Sachs chief economist Jan Hatzius called a September Federal Reserve rate hike 'very unlikely' in a Sunday note, citing soft retail sales, weak jobs data, and cooling inflation. Traders now price just a 30.6% chance of a hike next month, down sharply from a week earlier. However, Bitcoin has now failed to respond to two consecutive weeks of improving rate expectations, with the cryptocurrency declining 3% across the same week despite softer inflation prints removing a September hike from the base case. The Chicago Fed National Financial Conditions Index stood at minus 0.549 for the week ending Aug. 7, its fifth consecutive weekly decline and the loosest reading in the current run, while two-year Treasury yields fell from 4.25% to 4.15% and the 10-year yield declined from 4.70% to 4.64%.