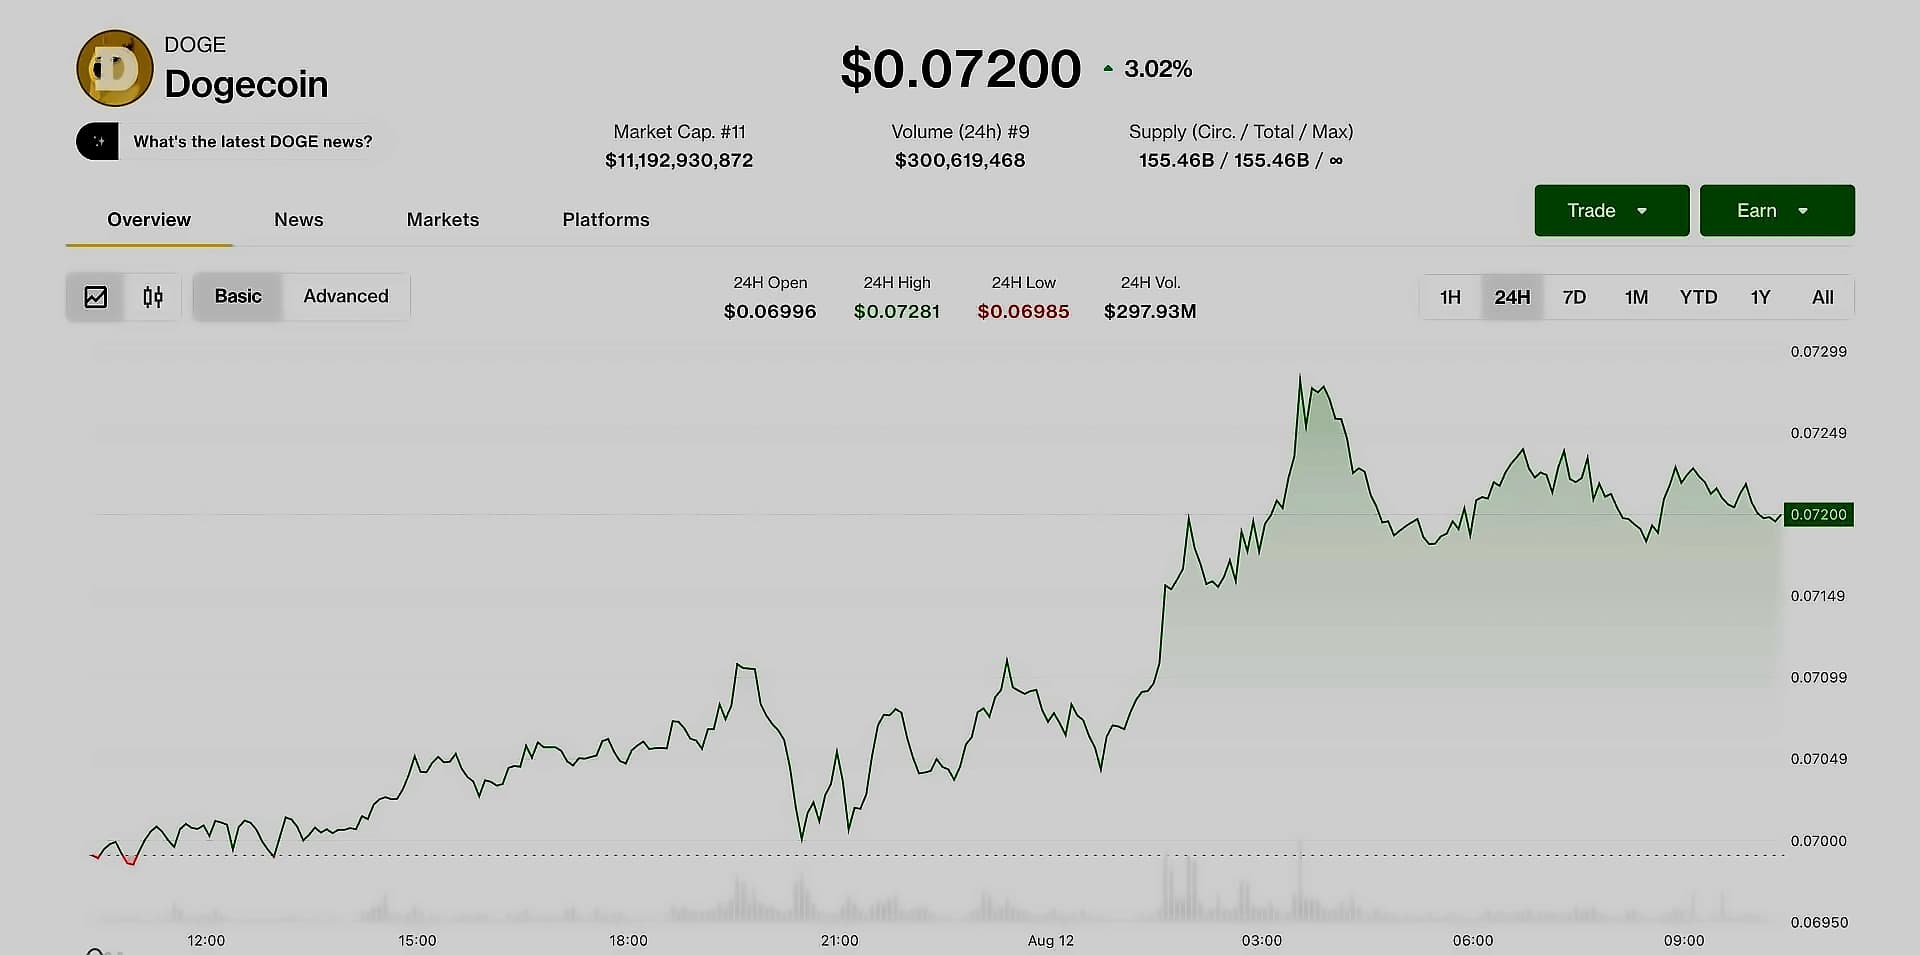
According to reports from AMBCrypto, Dogecoin was trading at $0.1107 at press time, representing a 3.5% daily gain despite facing significant technical headwinds. The memecoin has demonstrated relative strength by holding firmly above the $0.1-level since reclaiming it and extending its reach to above $0.11. However, the four-hour chart shows Dogecoin moving within a rising wedge pattern that often signals weakening momentum during an uptrend. The pattern suggests DOGE could break below its lower support line and slide toward the $0.103 area if bearish pressure strengthens further, with technical indicators including the Relative Strength Index and Chaikin Money Flow both trending lower during recent sessions.
Despite declining prices and weakening technical momentum, Dogecoin ETFs recorded more than $600,000 in inflows during May 5 and 6, marking a significant return of institutional demand after several quiet sessions. As reported by SoSoValue, DOGE ETFs became the first meme coin investment products to reach Wall Street after their launch last year, though trading activity has remained uneven compared with Bitcoin and Ethereum products. Between April 28 and May 4, DOGE ETFs reported no movement despite a steady recovery in the token price during that period. The return of inflows earlier this week attracted attention across the crypto market, showing that some institutional traders still expect additional upside for the meme coin.

As reported by AMBCrypto, despite reduced whale and retail activity across memecoins, Dogecoin buyers have returned with sustained demand. The memecoin recorded negative Spot Inflows for five consecutive days, with $102.7 million flowing out of exchanges compared to $95.6 million in inflows over the last 24 hours. This resulted in Spot Netflows dropping to -$7.04 million, indicating aggressive spot accumulation. In the derivatives market, $2.2 million worth of short positions were liquidated over 24 hours, while $608.5 million flowed into Futures positions compared to $577.2 million in inflows, with Futures Netflows rising 128% to $31.4 million.
According to AMBCrypto analysis, Dogecoin is currently testing its major resistance level at the 200-day EMA at $0.12. A successful retest of this level could open the path towards $0.15. However, the rising wedge pattern on the four-hour chart and declining momentum indicators suggest growing bearish pressure. The Bulls v Bears Power indicator shows bullish dominance since mid-April when DOGE reclaimed the $0.09-level, marking the longest streak of bullish dominance since September 2025. For the bullish outlook to maintain, DOGE must defend the $0.10 region as selling pressure increases across the market, with the projected downside target remaining limited compared with previous corrections.