Bitcoin dominance remains firmly above 60%, currently at 60.25%, demonstrating that Bitcoin continues to control the lion's share of the total crypto market despite recent altcoin strength. According to the latest market data, dominance has been holding firm around the 60% mark and hasn't broken lower, indicating that capital rotation into altcoins has not yet reached the critical threshold needed for a proper altseason. The metric gained 0.91% on the week and cleared the upper boundary of a triangle formation, with the last resistance sitting at 60.50%, a zone that capped the metric in April and May 2026. Support rests at 58.54%, with stronger support at 58% tested in June and July, suggesting that Bitcoin's dominance remains resilient even as altcoins show signs of life.
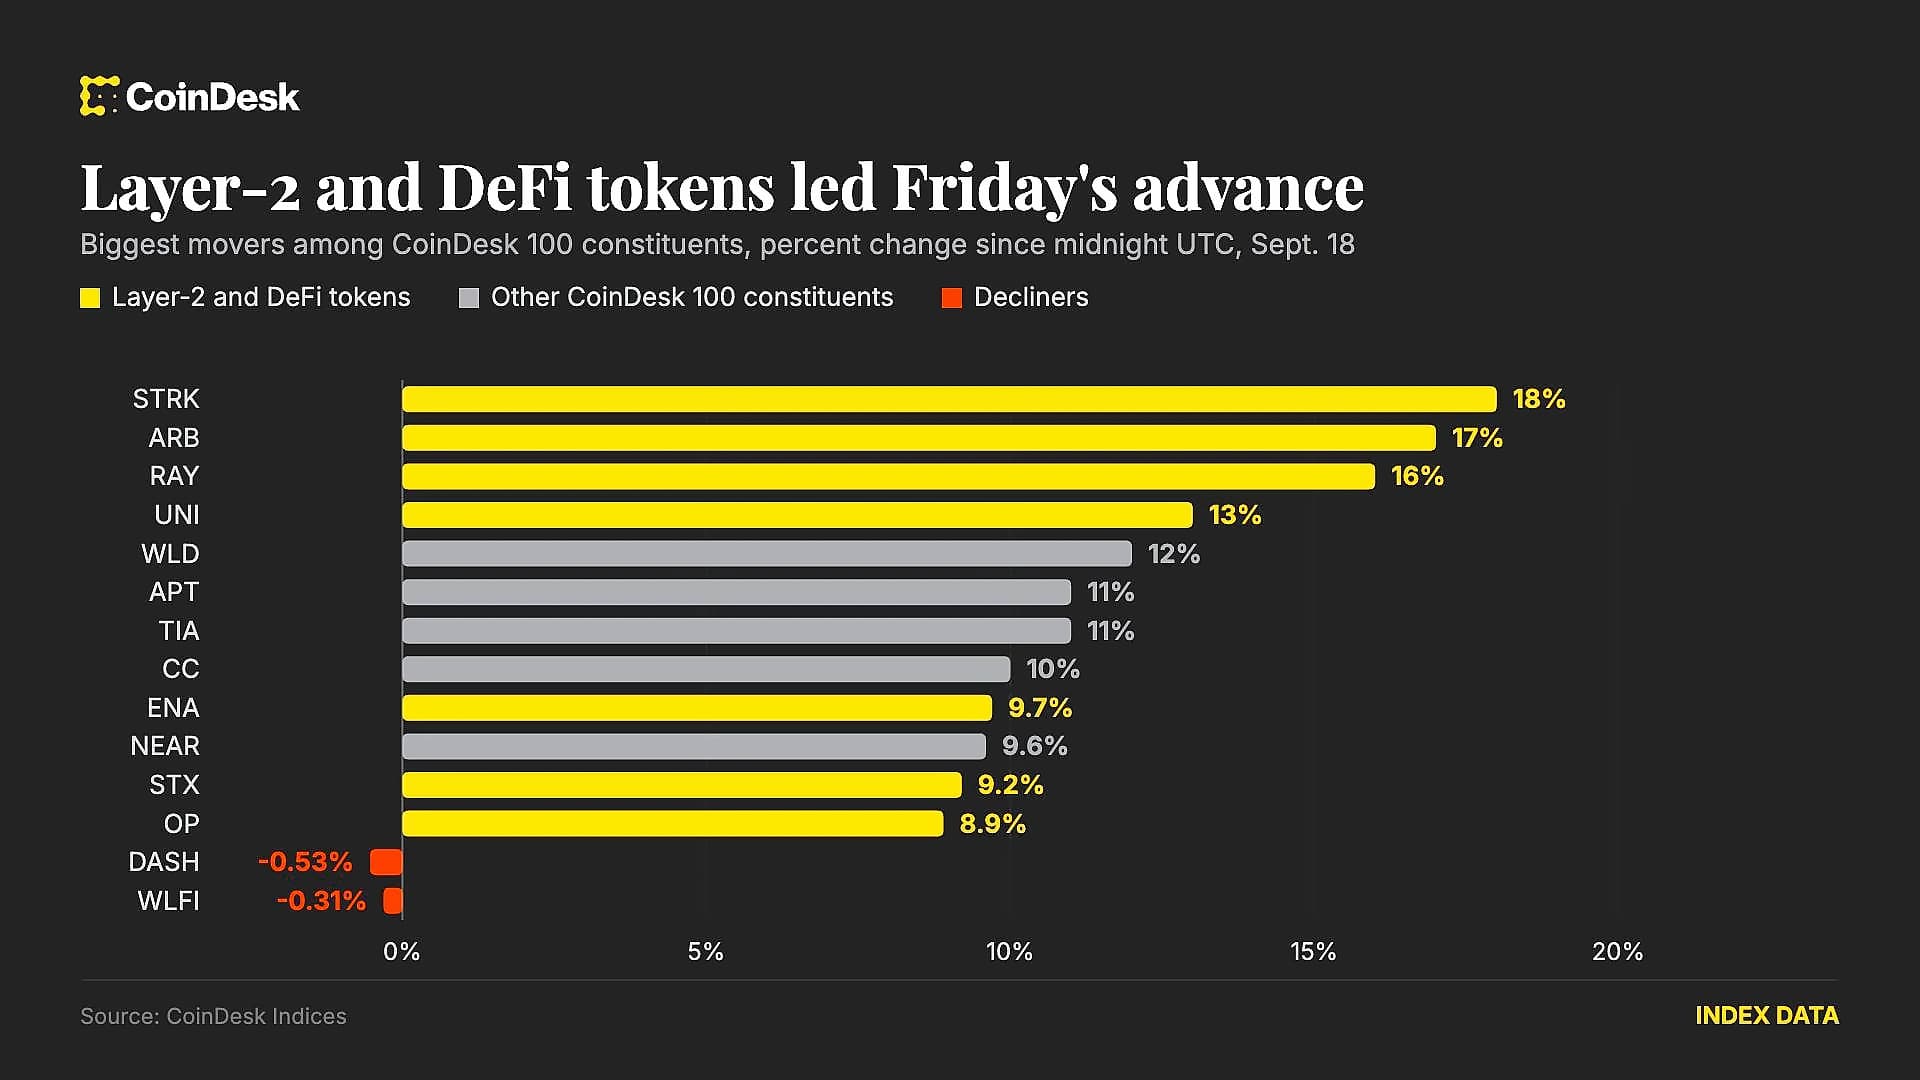
Total altcoin market cap (TOTAL2) has surged above $1 trillion from its $880 billion level, representing the strongest weekly performance in months with a 23% increase in market value. As reported by AMBCrypto, the category has also managed to break a long downtrend, going up from the $150-160 billion support area - a level that has held for approximately 1,000 days. Mid and small-cap assets were the strongest performers, with 56% of Binance-listed altcoins trading above their 200-day moving averages, a significant improvement from the 15%-20% figure last year. However, the Altcoin Season Index has dropped to 36, a far cry from the commonly associated 75 level, with the index actually declining from a recent reading of 46, indicating that altcoins are doing better but Bitcoin remains in the driver's seat.
Bitcoin delivered its biggest weekly gain in more than two years, climbing 22% and briefly approaching $80,000, marking the strongest performance since March 2024. According to the latest Bitcoin market report, this rally represents a significant shift in investor sentiment as capital finally leaves an overheated artificial intelligence (AI) trade. The movement reflects capital rotation toward cryptocurrency assets, with Bitcoin's 22% weekly gain confirming that capital is returning to crypto markets after months of AI-focused investment dominance. Last week's Bitcoin rally triggered $2.73 billion in short liquidations, representing the largest short-liquidation event on record, as reported by TradingView analyst Caleb Franzen. Bitcoin extended its rally above $71,000, reaching its highest level since June after breaking out of a six-week trading range between roughly $62,000 and $66,900, with BTC gaining about 11% over 24 hours and daily trading volume jumping 250% to $59 billion.

The ETH/BTC ratio has broken out of a long-term declining channel and reached a 7-month high near 0.0334, marking its highest level since January 2026. According to recent market data, Ethereum has gained 32.28% against Bitcoin since the June low at 0.02525, with the ratio peaking near 0.0334 on TradingView's weekly Binance chart. That move broke the descending parallel channel that had capped the pair since August 2025, with the breakout coming at the end of June and the ratio holding above the channel since. Resistance now sits at 0.03213, the 0.382 Fibonacci retracement of the decline from 0.04327, while above that, the 0.5 level at 0.03426 marks the next barrier. Support at 0.031 matters more, marking the April 2026 swing high for Ethereum against Bitcoin. The weekly Relative Strength Index (RSI) reads near 60 and continues to rise, with Ethereum trading at $2,472 and Bitcoin at $78,827 at the time of writing, placing the ratio near 0.0313.
Bitcoin has declined significantly amid macro pressures, quantum hacking fears, and speculative investors shifting capital toward artificial intelligence stocks. After peaking at $126k in 2025, Bitcoin corrected more than 50% to a June low of $59k. However, Bitcoin's historical pattern shows resilience, having dropped more than 50% from all-time highs on five occasions over the past decade, including the 2017-2018 bear market, March 2020 COVID crash, the 2021-2022 FTX bear market, and the May-July 2021 correction. Bitcoin retreated to its long-term 200-week moving average for the first time since 2023, a level that has historically contained bull markets since Bitcoin's inception. The previous two instances Bitcoin spent this much time below the 200-day moving average, Bitcoin was up 39% and 115% a year later respectively. Bitcoin just spent 6+ months below its 200-day moving average for the 3rd time in history, making this opportunity extremely rare in Bitcoin's history.