Bitcoin has crashed from $82K to $76,800 in mid-May 2026, representing a 6% decline that wiped out over $304 million in leveraged long positions market-wide. The cryptocurrency's fall coincided with a global bond market sell-off that saw the 30-year US Treasury yield breach 5.12%, reaching its highest level since 2007. The Fed's transition to new leadership under Jerome Powell has created a 'policy vacuum' that prevents the traditional 'Fed put' from providing market support. Market expectations for rate cuts have plummeted to just 15% probability, with even a 25 basis point hike by July 2027 rising to 60%, fundamentally altering Bitcoin's risk-reward dynamics.
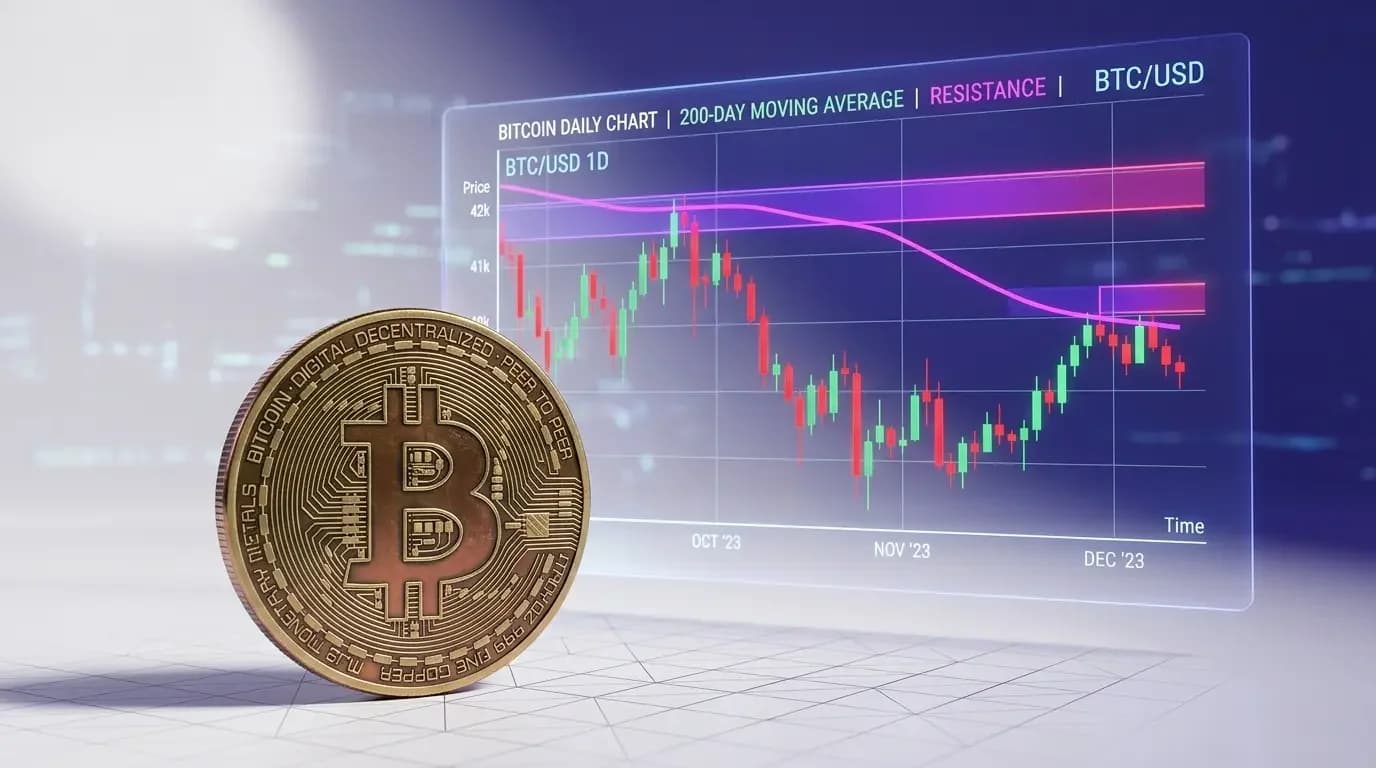
According to CryptoQuant's Julio Moreno, Bitcoin's current condition mirrors the March 2022 pattern when BTC surged 43% from its lows, kissed the 200-day MA, and resumed its downtrend. This time, BTC rose by 37% from its April 2025 lows before facing the same ceiling at the $82,000 level. The same pattern is uncomfortably matched by March 2022, when BTC hit resistance at the 200-day moving average before pulling back to as low as $76,000. However, the current decline is amplified by triple selling pressure - persistent ETF outflows, simultaneous active selling in both spot and futures markets, and sharp increase in options hedging demand.
The clearest signal came from U.S. spot Bitcoin ETFs, which recorded $648 million in net outflows on May 18, marking the third-largest single-day exit of 2026. For the week of May 7-15, cumulative outflows exceeded $1.5 billion, the heaviest weekly withdrawal since January. U.S. spot ETFs have flipped to net sellers, offloading around 4,000 BTC after buying as much as 64,000 BTC over a prior 30-day window. The institutional capital exodus indicates a fundamental shift in macro pricing logic, with investors no longer viewing Bitcoin as a beneficiary of loose monetary policy but incorporating it into traditional risk asset frameworks for hedging purposes.
The 200-day moving average sits at approximately $82K-$82.5K, with price rallying to $82.4K and being immediately rejected, confirming the 200 DMA as active resistance. Adding to the resistance, an unfilled CME futures gap from early February spans roughly $80K-$85K, with last week's rally partially filling the gap. If the current level fails, the first structural support is the weekly Bollinger Band lower rail in the $71K area, representing roughly a 7% decline and aligning with the S21 miner shutdown zone. Below that, the 200-week moving average at $63K-$65K serves as strong structural support, forming a potential H1 2026 double bottom with the February low of $59.9K. Vikram Subburaj from Giottus exchange identifies $76,000 as Bitcoin's first support level, with a secondary support zone between $74,000-$75,000 that corresponds to pre-2024 ETF rally levels.
On the derivatives side, Bitcoin open interest stands at approximately $56.5 billion, with the May 13-14 sell-off triggering massive spikes in long liquidations. BTC perpetual funding rates have been negative since early March, the longest stretch since 2023, meaning shorts have been the dominant force for months. The decline represents the convergence of several forces, with both on-chain and off-chain capital bleeding simultaneously through ETF outflows and derivatives liquidations. The 25-Delta put skew for options rose rapidly from 10.9% to 14.4%, reflecting a significant increase in market participants' demand for downside protection. Despite the bearish sentiment, net Bitcoin inflows to exchanges reached $1.68 billion per week, with approximately $1.68 billion flowing into cold wallets as some long-term holders accumulate at lower prices.